
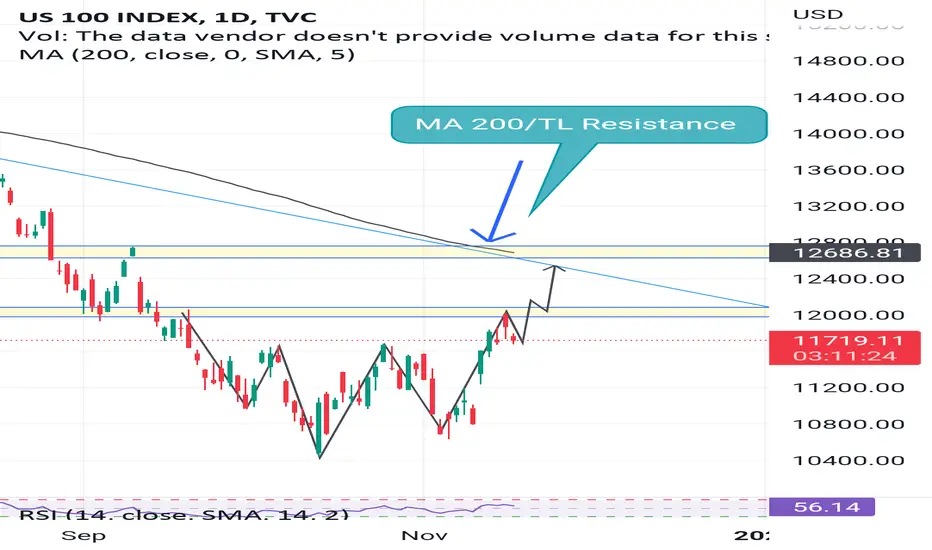
Nasdaq creating inverse head and shoulder pattern on daily chart and now testing the breakout neck line
It can easily go up to upper trendline and 200 Ma area which is also last high low were it has to chance to start fadingout as we are still in bear market 🐻
Micro bulish
Macro bearish
DYOR!
It can easily go up to upper trendline and 200 Ma area which is also last high low were it has to chance to start fadingout as we are still in bear market 🐻
Micro bulish
Macro bearish
DYOR!

คำจำกัดสิทธิ์ความรับผิดชอบ
ข้อมูลและบทความไม่ได้มีวัตถุประสงค์เพื่อก่อให้เกิดกิจกรรมทางการเงิน, การลงทุน, การซื้อขาย, ข้อเสนอแนะ หรือคำแนะนำประเภทอื่น ๆ ที่ให้หรือรับรองโดย TradingView อ่านเพิ่มเติมใน ข้อกำหนดการใช้งาน
คำจำกัดสิทธิ์ความรับผิดชอบ
ข้อมูลและบทความไม่ได้มีวัตถุประสงค์เพื่อก่อให้เกิดกิจกรรมทางการเงิน, การลงทุน, การซื้อขาย, ข้อเสนอแนะ หรือคำแนะนำประเภทอื่น ๆ ที่ให้หรือรับรองโดย TradingView อ่านเพิ่มเติมใน ข้อกำหนดการใช้งาน