
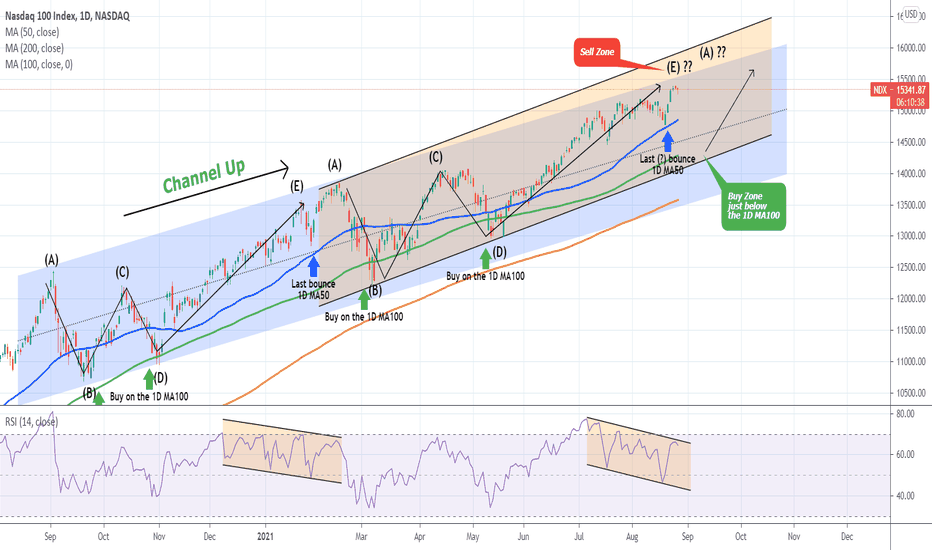
This idea is a continuation to my analysis posted on August 26:
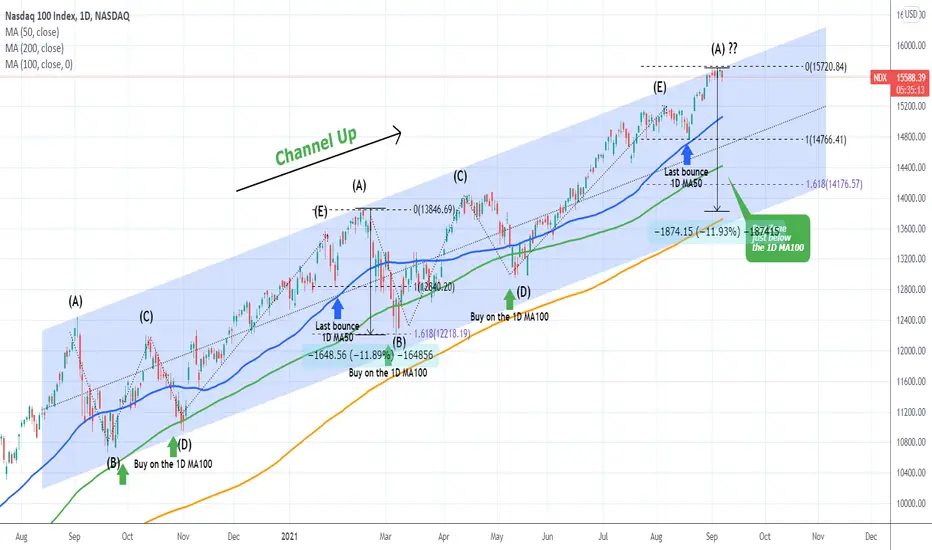
It appears that the leg count and the similarities (so far) of the current price action with the January-February sequence was correct. If the pattern continues to replicate in the same way, then Nasdaq is ahead of a strong correction as this suggests we are currently at the top of the last leg (A).
In February 2021 that resulted in almost a -12% correction that broke below the 1D MA100 (green trend-line) before rebounding. -12% from the top suggests a pull-back value of 13840 while the 1D MA100 is currently at 14417. Perhaps a Fibonacci extension measurement from the last Higher Low (the bounce on the 1D MA50 (blue trend-line)), would be more accurate. In February the correction stopped exactly on the 1.618. Currently the 1.618 Fib ext is at 14176.50.
If this is indeed the start of a similar correction within the long-term Channel Up, is that a reasonable target for you?
** Please support this idea with your likes and comments, it is the best way to keep it relevant and support me. **
--------------------------------------------------------------------------------------------------------
!! Donations via TradingView coins also help me a great deal at posting more free trading content and signals here !!
🎉 👍 Shout-out to TradingShot's 💰 top TradingView Coin donor 💰 this week ==> GJMRealEstate
--------------------------------------------------------------------------------------------------------
It appears that the leg count and the similarities (so far) of the current price action with the January-February sequence was correct. If the pattern continues to replicate in the same way, then Nasdaq is ahead of a strong correction as this suggests we are currently at the top of the last leg (A).
In February 2021 that resulted in almost a -12% correction that broke below the 1D MA100 (green trend-line) before rebounding. -12% from the top suggests a pull-back value of 13840 while the 1D MA100 is currently at 14417. Perhaps a Fibonacci extension measurement from the last Higher Low (the bounce on the 1D MA50 (blue trend-line)), would be more accurate. In February the correction stopped exactly on the 1.618. Currently the 1.618 Fib ext is at 14176.50.
If this is indeed the start of a similar correction within the long-term Channel Up, is that a reasonable target for you?
** Please support this idea with your likes and comments, it is the best way to keep it relevant and support me. **
--------------------------------------------------------------------------------------------------------
!! Donations via TradingView coins also help me a great deal at posting more free trading content and signals here !!
🎉 👍 Shout-out to TradingShot's 💰 top TradingView Coin donor 💰 this week ==> GJMRealEstate
--------------------------------------------------------------------------------------------------------

I trade Crypto, Forex, Indices & Commodities on PrimeXBT — all from one account with TradingView charts 👉 tradingshot.short.gy/PrimeXBT
I also use TradeNation for fixed spreads & zero commission 👉 tradingshot.short.gy/Tradenation
I also use TradeNation for fixed spreads & zero commission 👉 tradingshot.short.gy/Tradenation
คำจำกัดสิทธิ์ความรับผิดชอบ
ข้อมูลและบทความไม่ได้มีวัตถุประสงค์เพื่อก่อให้เกิดกิจกรรมทางการเงิน, การลงทุน, การซื้อขาย, ข้อเสนอแนะ หรือคำแนะนำประเภทอื่น ๆ ที่ให้หรือรับรองโดย TradingView อ่านเพิ่มเติมใน ข้อกำหนดการใช้งาน
I trade Crypto, Forex, Indices & Commodities on PrimeXBT — all from one account with TradingView charts 👉 tradingshot.short.gy/PrimeXBT
I also use TradeNation for fixed spreads & zero commission 👉 tradingshot.short.gy/Tradenation
I also use TradeNation for fixed spreads & zero commission 👉 tradingshot.short.gy/Tradenation
คำจำกัดสิทธิ์ความรับผิดชอบ
ข้อมูลและบทความไม่ได้มีวัตถุประสงค์เพื่อก่อให้เกิดกิจกรรมทางการเงิน, การลงทุน, การซื้อขาย, ข้อเสนอแนะ หรือคำแนะนำประเภทอื่น ๆ ที่ให้หรือรับรองโดย TradingView อ่านเพิ่มเติมใน ข้อกำหนดการใช้งาน