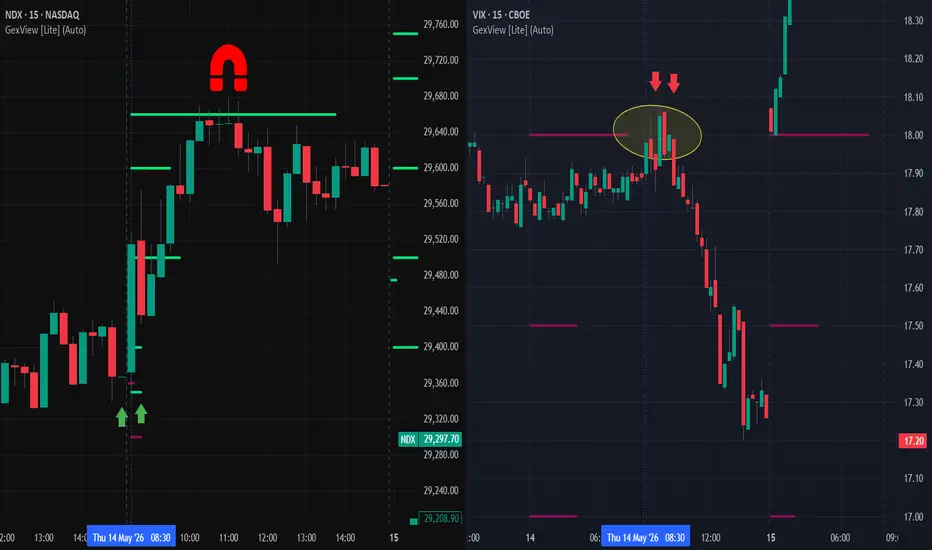
This example is from May 14, 2026.
My setup is based on Gamma Exposure (GEX):
1. Left Chart
Ticker: Nasdaq 100 Index ( NDX )
NDX )
Gamma Exposure: 0DTE (expiration: May 14, 2026)
Time Trigger: Regular Trading Hours (RTH) opening
Target: The largest 0DTE GEX level at 29,660, which tends to act as a magnet price level.
2. Right Chart
Ticker: Volatility Index ( VIX )
VIX )
Gamma Exposure: Nearest expiration (May 19, 2026)
Pattern: A false breakout inVIX above the largest GEX level (18), while at the same time NDX begins moving toward its intraday target.
I see this pattern occur very frequently. I focus on identifying the largest 0DTE GEX level in a major asset such as SPX ,
SPX ,  SPY , NDX , or
  QQQ , and then look for confirmation from the opposite move in
  VIX .
VIX .
As Linda Raschke said:
“All you need is one pattern to make a living.”
My setup is based on Gamma Exposure (GEX):
1. Left Chart
Ticker: Nasdaq 100 Index (
NDX )Gamma Exposure: 0DTE (expiration: May 14, 2026)
Time Trigger: Regular Trading Hours (RTH) opening
Target: The largest 0DTE GEX level at 29,660, which tends to act as a magnet price level.
2. Right Chart
Ticker: Volatility Index (
VIX )Gamma Exposure: Nearest expiration (May 19, 2026)
Pattern: A false breakout in
VIX above the largest GEX level (18), while at the same time NDX begins moving toward its intraday target.I see this pattern occur very frequently. I focus on identifying the largest 0DTE GEX level in a major asset such as
SPX , SPY , NDX , or QQQ , and then look for confirmation from the opposite move in VIX .As Linda Raschke said:
“All you need is one pattern to make a living.”

คำจำกัดสิทธิ์ความรับผิดชอบ
ข้อมูลและบทความไม่ได้มีวัตถุประสงค์เพื่อก่อให้เกิดกิจกรรมทางการเงิน, การลงทุน, การซื้อขาย, ข้อเสนอแนะ หรือคำแนะนำประเภทอื่น ๆ ที่ให้หรือรับรองโดย TradingView อ่านเพิ่มเติมใน ข้อกำหนดการใช้งาน
คำจำกัดสิทธิ์ความรับผิดชอบ
ข้อมูลและบทความไม่ได้มีวัตถุประสงค์เพื่อก่อให้เกิดกิจกรรมทางการเงิน, การลงทุน, การซื้อขาย, ข้อเสนอแนะ หรือคำแนะนำประเภทอื่น ๆ ที่ให้หรือรับรองโดย TradingView อ่านเพิ่มเติมใน ข้อกำหนดการใช้งาน