
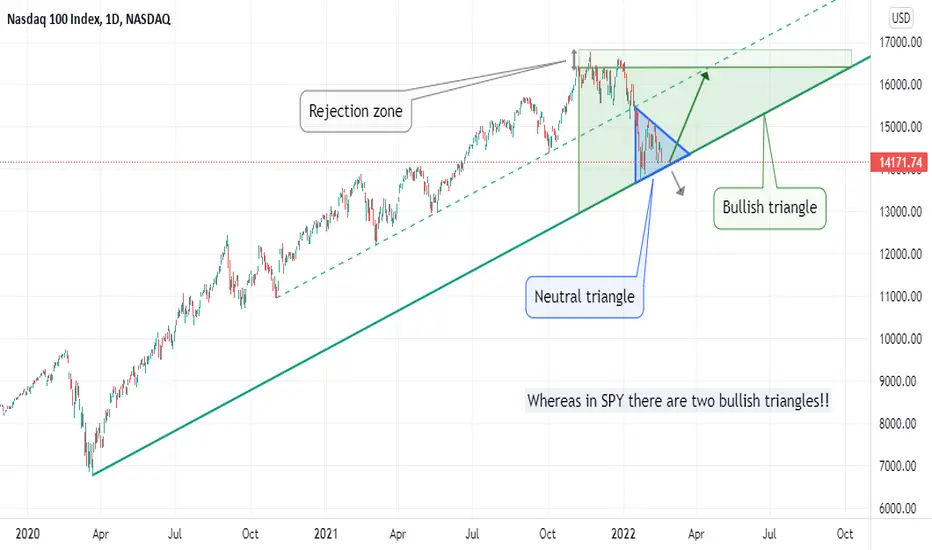
For the Nasdaq100 and S&P500 !!

Huge risk / reward if it goes to the rejection zone.
Btw I'm thinking to sell only when my technical indicators will turned bearish, and not at a fixed price.
There is a risk of the Nasdaq symmetrical triangle pattern leads to a break trough the support.
Be careful to disable your buy orders during the pre and post-market, a breakaway gap could easily invalidate these patterns.
Idea to be used with your favourites technical indicators (Squeeze momentum indicator [LazyBear], MACD etc...).
I will set a BUY LMT at +0.40% over the support and a SELL STP at -0.25%
For beginners: give a look to courses (investopedia or tradingview) about triangle pattern: descending triangle pattern, ascending triangle pattern and symmetrical triangle pattern .
Huge risk / reward if it goes to the rejection zone.
Btw I'm thinking to sell only when my technical indicators will turned bearish, and not at a fixed price.
There is a risk of the Nasdaq symmetrical triangle pattern leads to a break trough the support.
Be careful to disable your buy orders during the pre and post-market, a breakaway gap could easily invalidate these patterns.
Idea to be used with your favourites technical indicators (Squeeze momentum indicator [LazyBear], MACD etc...).
I will set a BUY LMT at +0.40% over the support and a SELL STP at -0.25%
For beginners: give a look to courses (investopedia or tradingview) about triangle pattern: descending triangle pattern, ascending triangle pattern and symmetrical triangle pattern .

คำจำกัดสิทธิ์ความรับผิดชอบ
ข้อมูลและบทความไม่ได้มีวัตถุประสงค์เพื่อก่อให้เกิดกิจกรรมทางการเงิน, การลงทุน, การซื้อขาย, ข้อเสนอแนะ หรือคำแนะนำประเภทอื่น ๆ ที่ให้หรือรับรองโดย TradingView อ่านเพิ่มเติมใน ข้อกำหนดการใช้งาน
คำจำกัดสิทธิ์ความรับผิดชอบ
ข้อมูลและบทความไม่ได้มีวัตถุประสงค์เพื่อก่อให้เกิดกิจกรรมทางการเงิน, การลงทุน, การซื้อขาย, ข้อเสนอแนะ หรือคำแนะนำประเภทอื่น ๆ ที่ให้หรือรับรองโดย TradingView อ่านเพิ่มเติมใน ข้อกำหนดการใช้งาน