Long
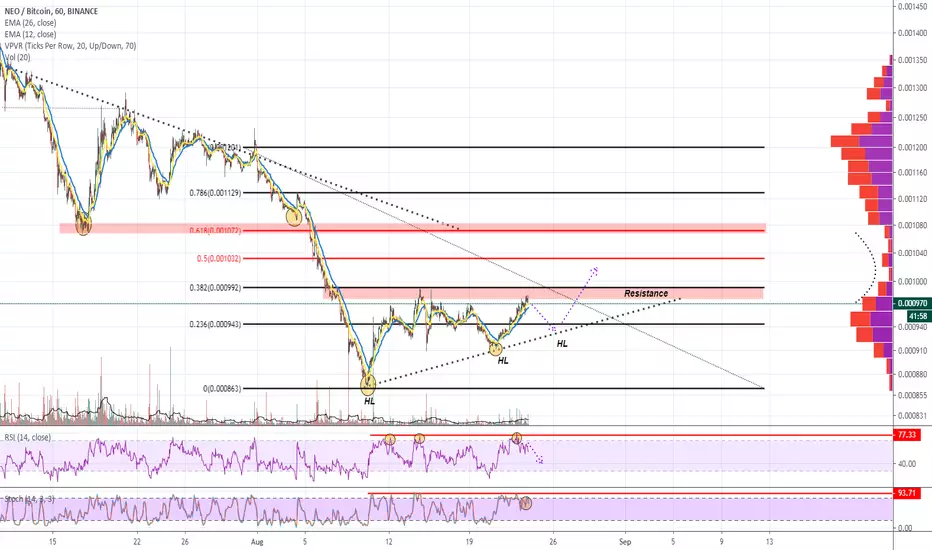
NEOBTC Potential Ascending Triangle
Hello Traders,
Welcome back to another chart, today's chart will be on NEO, formerly known as Ant-Shares, surely a re-brand back?
Points to consider,
- Price testing resistance zone (Red Zone - .382 Fibonacci Zone)
- RSI bouncing of overbought region
- Stochs showing downwards momentum
- EMA's action as support for price at current given time
- Volume is near to none --> Below average
- VPVR is showing low volume of transactions between current resistant zones
NEO could be forming a potential Ascending Triangle which is technically a bullish formation, however this needs to be confirmed with a third touch on the support line. NEO is more probable to retrace from this zone as the RSI is coming of overbought regions, with the stoch's showing downwards momentum, a retracement to the support line is highly probable. If and when NEO breaks out of this current resistant zone, we may see a retest of the .618 Fibonacci Zone quickly as VPVR is showing significantly low volume of transactions between the two zones..
What are your thoughts?
Please leave a like a comment
and remember
"There's no such things as a free lunch"- Milton Friedman
Welcome back to another chart, today's chart will be on NEO, formerly known as Ant-Shares, surely a re-brand back?
Points to consider,
- Price testing resistance zone (Red Zone - .382 Fibonacci Zone)
- RSI bouncing of overbought region
- Stochs showing downwards momentum
- EMA's action as support for price at current given time
- Volume is near to none --> Below average
- VPVR is showing low volume of transactions between current resistant zones
NEO could be forming a potential Ascending Triangle which is technically a bullish formation, however this needs to be confirmed with a third touch on the support line. NEO is more probable to retrace from this zone as the RSI is coming of overbought regions, with the stoch's showing downwards momentum, a retracement to the support line is highly probable. If and when NEO breaks out of this current resistant zone, we may see a retest of the .618 Fibonacci Zone quickly as VPVR is showing significantly low volume of transactions between the two zones..
What are your thoughts?
Please leave a like a comment
and remember
"There's no such things as a free lunch"- Milton Friedman

Join the Free Trading Group
Telegram: t.me/freetradingden 🔥
Claim $1000 Deposit Bonus 🎁
Trade with perks & support the community!
partner.blofin.com/d/TheAlchemist
Stay sharp, trade smart.
— Team The Alchemist ⚔️
Telegram: t.me/freetradingden 🔥
Claim $1000 Deposit Bonus 🎁
Trade with perks & support the community!
partner.blofin.com/d/TheAlchemist
Stay sharp, trade smart.
— Team The Alchemist ⚔️
คำจำกัดสิทธิ์ความรับผิดชอบ
ข้อมูลและบทความไม่ได้มีวัตถุประสงค์เพื่อก่อให้เกิดกิจกรรมทางการเงิน, การลงทุน, การซื้อขาย, ข้อเสนอแนะ หรือคำแนะนำประเภทอื่น ๆ ที่ให้หรือรับรองโดย TradingView อ่านเพิ่มเติมใน ข้อกำหนดการใช้งาน
Join the Free Trading Group
Telegram: t.me/freetradingden 🔥
Claim $1000 Deposit Bonus 🎁
Trade with perks & support the community!
partner.blofin.com/d/TheAlchemist
Stay sharp, trade smart.
— Team The Alchemist ⚔️
Telegram: t.me/freetradingden 🔥
Claim $1000 Deposit Bonus 🎁
Trade with perks & support the community!
partner.blofin.com/d/TheAlchemist
Stay sharp, trade smart.
— Team The Alchemist ⚔️
คำจำกัดสิทธิ์ความรับผิดชอบ
ข้อมูลและบทความไม่ได้มีวัตถุประสงค์เพื่อก่อให้เกิดกิจกรรมทางการเงิน, การลงทุน, การซื้อขาย, ข้อเสนอแนะ หรือคำแนะนำประเภทอื่น ๆ ที่ให้หรือรับรองโดย TradingView อ่านเพิ่มเติมใน ข้อกำหนดการใช้งาน