
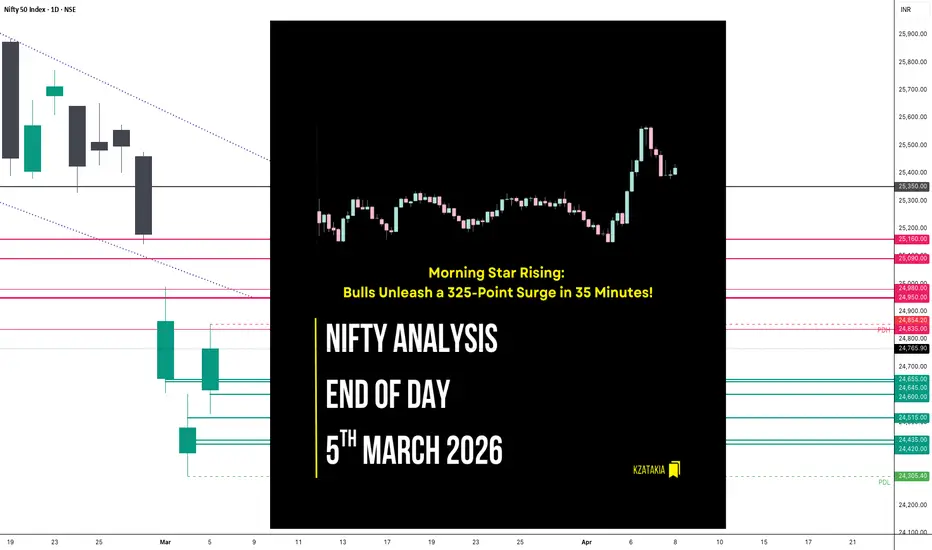
🟢 Nifty Analysis EOD – March 5, 2026 – Thursday 🔴
Morning Star Rising: Bulls Unleash a 325-Point Surge in 35 Minutes!
🗞 Nifty Summary
The Nifty started the day with a strong 143-point Gap Up. After an initial 35-point rise, the index dipped 122 points to complete the gap-filling process, establishing an Initial Balance (IB) range of 24,530 ~ 24,656. For most of the day, the market remained in a dull, range-bound state.
However, the true fireworks began at 2:15 PM. After testing the IBL, Nifty launched an explosive 325-point vertical rally in just 35 minutes, marking a day high of 24,854. In typical volatile fashion, the index surrendered 150 points from the peak around 3:00 PM to end the day at 24,737.45 (Adjusted close: 24,765.90), gaining +285.40 points (+1.17%).
Evaluating the last three sessions, the daily time frame is now forming a Morning Star candlestick pattern, which is a classic bullish reversal signal.
For the upcoming session, the opening price will be the most important factor. The 24,950 ~ 24,980 zone stands as a major resistance, while bulls need to sustain above 24,515 ~ 24,480 to continue building a base. This 500-point range will be the crucial battlefield tomorrow.
🛡 5 Min Intraday Chart with Levels

📉 Daily Time Frame Chart with Intraday Levels

🕯 Daily Candle Breakdown
Open: 24,615.95
High: 24,854.20
Low: 24,529.40
Close: 24,765.90
Change: +285.40 (+1.17%)
🏗️ Structure Breakdown
Type: Bullish candle with balanced wicks.
Range: ≈ 325 points — Very high volatility.
Body: ≈ 150 points — Strong bullish real body.
Upper Wick: ≈ 88 points — Profit booking seen after the 2:15 PM spike.
Lower Wick: ≈ 86 points — Successful gap-fill and defense of lower levels.
🛡 5 Min Intraday Chart

⚔️ Gladiator Strategy Update
ATR: 345.19
IB Range: 126.65 → Medium
Market Structure: Imbalanced
Trade Highlights:
13:41 Short Trade: Trailing SL Hit (Contra trade attempted at IBH rejection).
14:38 Long Trade: Target Hit (R:R 1:2.61) (Pattern + IBH Breakout).
Trade Summary:
Today required patience during the long sideways grind. I attempted a short trade at 1:41 PM which didn’t go far and hit the trailing stop. However, the system caught the massive afternoon expansion at 2:38 PM. Waiting for that confirmed IBH breakout was the right move, yielding a solid 1:2.61 reward as the market went into “beast mode.”
🧱 Support & Resistance Levels
Resistance Zones: 24,835 | 24,950 ~ 24,980
Support Zones: 24,655 ~ 24,645 | 24,600 | 24,515 | 24,435 ~ 24,420
🧠 Final Thoughts
“The Morning Star is shining, but the path ahead has hurdles.”
The reversal pattern on the daily chart is encouraging, but we cannot ignore the sharp 150-point drop at the end of the day. It shows that bears are still ready to sell at higher levels.
Tomorrow will likely be a volatile tug-of-war within the 500-point zone I mentioned. I will stay practical: let the IB form, watch the 24,835 level, and only trade when the structure is clear. Discipline over excitement.
✏️ Disclaimer
This is my personal digital diary and represents my own analysis and point of view. It is not financial advice; please consult a professional advisor before making any trading decisions.
Morning Star Rising: Bulls Unleash a 325-Point Surge in 35 Minutes!
🗞 Nifty Summary
The Nifty started the day with a strong 143-point Gap Up. After an initial 35-point rise, the index dipped 122 points to complete the gap-filling process, establishing an Initial Balance (IB) range of 24,530 ~ 24,656. For most of the day, the market remained in a dull, range-bound state.
However, the true fireworks began at 2:15 PM. After testing the IBL, Nifty launched an explosive 325-point vertical rally in just 35 minutes, marking a day high of 24,854. In typical volatile fashion, the index surrendered 150 points from the peak around 3:00 PM to end the day at 24,737.45 (Adjusted close: 24,765.90), gaining +285.40 points (+1.17%).
Evaluating the last three sessions, the daily time frame is now forming a Morning Star candlestick pattern, which is a classic bullish reversal signal.
For the upcoming session, the opening price will be the most important factor. The 24,950 ~ 24,980 zone stands as a major resistance, while bulls need to sustain above 24,515 ~ 24,480 to continue building a base. This 500-point range will be the crucial battlefield tomorrow.
🛡 5 Min Intraday Chart with Levels
📉 Daily Time Frame Chart with Intraday Levels
🕯 Daily Candle Breakdown
Open: 24,615.95
High: 24,854.20
Low: 24,529.40
Close: 24,765.90
Change: +285.40 (+1.17%)
🏗️ Structure Breakdown
Type: Bullish candle with balanced wicks.
Range: ≈ 325 points — Very high volatility.
Body: ≈ 150 points — Strong bullish real body.
Upper Wick: ≈ 88 points — Profit booking seen after the 2:15 PM spike.
Lower Wick: ≈ 86 points — Successful gap-fill and defense of lower levels.
🛡 5 Min Intraday Chart
⚔️ Gladiator Strategy Update
ATR: 345.19
IB Range: 126.65 → Medium
Market Structure: Imbalanced
Trade Highlights:
13:41 Short Trade: Trailing SL Hit (Contra trade attempted at IBH rejection).
14:38 Long Trade: Target Hit (R:R 1:2.61) (Pattern + IBH Breakout).
Trade Summary:
Today required patience during the long sideways grind. I attempted a short trade at 1:41 PM which didn’t go far and hit the trailing stop. However, the system caught the massive afternoon expansion at 2:38 PM. Waiting for that confirmed IBH breakout was the right move, yielding a solid 1:2.61 reward as the market went into “beast mode.”
🧱 Support & Resistance Levels
Resistance Zones: 24,835 | 24,950 ~ 24,980
Support Zones: 24,655 ~ 24,645 | 24,600 | 24,515 | 24,435 ~ 24,420
🧠 Final Thoughts
“The Morning Star is shining, but the path ahead has hurdles.”
The reversal pattern on the daily chart is encouraging, but we cannot ignore the sharp 150-point drop at the end of the day. It shows that bears are still ready to sell at higher levels.
Tomorrow will likely be a volatile tug-of-war within the 500-point zone I mentioned. I will stay practical: let the IB form, watch the 24,835 level, and only trade when the structure is clear. Discipline over excitement.
✏️ Disclaimer
This is my personal digital diary and represents my own analysis and point of view. It is not financial advice; please consult a professional advisor before making any trading decisions.

Read my blogs here:
substack.com/@kzatakia
Follow me on Telegram:
t.me/swingtraderhub
Follow me on X:
x.com/kzatakia
substack.com/@kzatakia
Follow me on Telegram:
t.me/swingtraderhub
Follow me on X:
x.com/kzatakia
การนำเสนอที่เกี่ยวข้อง
คำจำกัดสิทธิ์ความรับผิดชอบ
ข้อมูลและบทความไม่ได้มีวัตถุประสงค์เพื่อก่อให้เกิดกิจกรรมทางการเงิน, การลงทุน, การซื้อขาย, ข้อเสนอแนะ หรือคำแนะนำประเภทอื่น ๆ ที่ให้หรือรับรองโดย TradingView อ่านเพิ่มเติมใน ข้อกำหนดการใช้งาน
Read my blogs here:
substack.com/@kzatakia
Follow me on Telegram:
t.me/swingtraderhub
Follow me on X:
x.com/kzatakia
substack.com/@kzatakia
Follow me on Telegram:
t.me/swingtraderhub
Follow me on X:
x.com/kzatakia
การนำเสนอที่เกี่ยวข้อง
คำจำกัดสิทธิ์ความรับผิดชอบ
ข้อมูลและบทความไม่ได้มีวัตถุประสงค์เพื่อก่อให้เกิดกิจกรรมทางการเงิน, การลงทุน, การซื้อขาย, ข้อเสนอแนะ หรือคำแนะนำประเภทอื่น ๆ ที่ให้หรือรับรองโดย TradingView อ่านเพิ่มเติมใน ข้อกำหนดการใช้งาน