
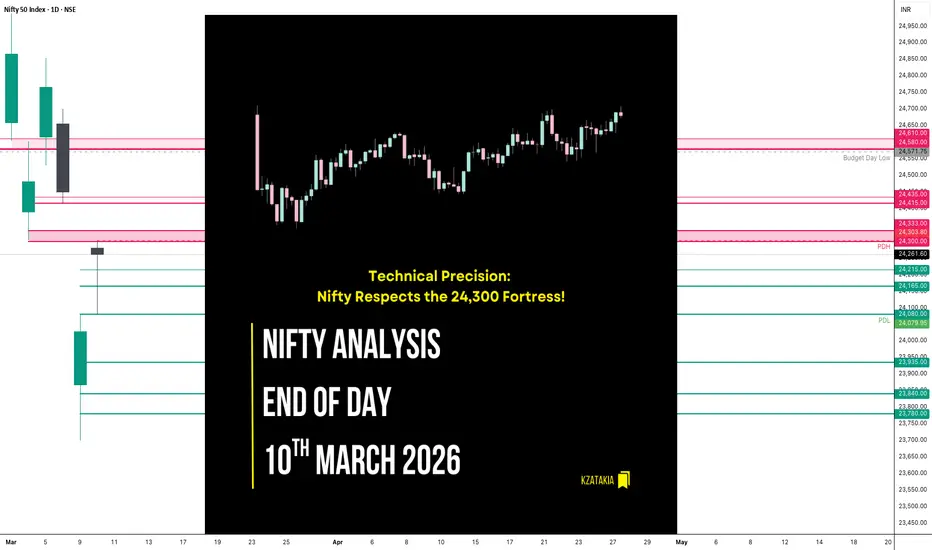
🟢 Nifty Analysis EOD – March 10, 2026 – Tuesday 🔴
Technical Precision: Nifty Respects the 24,300 Fortress!
🗞 Nifty Summary
Today was a session of remarkable technical discipline, especially considering it was a weekly expiry day for Nifty.
The index opened above the PDH with a powerful 280-point Gap Up, placing it directly into the 24,300 ~ 24,333 resistance zone identified in previous notes.
After the opening tick, Nifty witnessed a sharp 207-point dip to fill the gap, finding solid support at the PDH. From there, bulls regained control, breaching the IBH but struggling to cross the Daily Fib 0.786 level (24,250).
The subsequent retracement phases twice tested and held the Daily Fib 0.618 support, providing a launchpad for another charge toward the highs.
Nifty eventually ended the day very close to its peak at 24,286.15 (Adjusted close: 24,261.60), gaining +233.55 points (+0.97%).
The market’s behavior today was a masterclass in respecting structural levels; the “hush and fush” of typical expiry volatility was absent, replaced by a rhythmic movement between Fibonacci levels. The defense of the 0.618 level during mid-day retracements confirmed that buyers were willing to accumulate even at these higher levels.
While the session was calm and predictable, the shadow of the war continues to loom. By forming a Higher High formation on the daily chart, the bulls have kept the recovery narrative alive, though the path ahead remains steep, with the 24,300 ~ 24,333 and 24580 ~ 24610 zone acting as a massive gate that requires sustained volume to truly shatter.
🛡 5 Min Intraday Chart with Levels

📉 Daily Time Frame Chart with Intraday Levels

🕯 Daily Candle Breakdown
Open: 24,280.80
High: 24,303.80
Low: 24,079.95
Close: 24,261.60
Change: +233.55 (+0.97%)
🏗️ Structure Breakdown
Type: Bearish-bodied candle (on an intraday basis) with a massive lower tail.
Range: ≈ 224 points — high volatility.
Body: ≈ 19 points — very small real body, signaling a struggle to close significantly above the open.
Upper Wick: ≈ 23 points — minor resistance encountered at the 24,300 ceiling.
Lower Wick: ≈ 182 points — Aggressive rejection of lower prices, confirming strong demand on the gap-fill.
🛡 5 Min Intraday Chart

⚔️ Gladiator Strategy Update
ATR: 375.32
IB Range: 223.85 → Medium (Relative to ATR)
Market Structure: Imbalanced
Trade Highlights:
10:31 Long Trade: Target Hit (R:R 1:2.56)
12:50 Long Trade: Target Hit (R:R 1:2.24)
Trade Summary: I simply followed the levels today without overthinking. The morning dip to PDH and the 0.618 Fib defense provided clear entries. I’m glad the market respected the zones, which helped me stay calm and reach my targets.
🧱 Support & Resistance Levels
Resistance Zones: 24,300 ~ 24,333 | 24,415 ~ 24,435 | 24,580 ~ 24,610
Support Zones: 24,165 | 24,080 | 23,935
🧠 Final Thoughts
“Technicals provide the map, but news provides the weather.”
We are seeing a constructive Higher High formation, which is a positive sign for the bulls.
However, we are not out of the woods yet. The war front remains unpredictable, and any sudden news could easily derail this recovery.
For the upcoming session, I will cautiously look for upside targets only if the current formation stays intact. The 24,333 and 24415 ~ 24435 level is the main challenge for tomorrow; crossing it could change the landscape, but until then, I will remain practical and trade level-to-level.
✏️ Disclaimer
This is my personal digital diary and represents my own analysis and point of view. It is not financial advice; please consult a professional advisor before making any trading decisions.
Technical Precision: Nifty Respects the 24,300 Fortress!
🗞 Nifty Summary
Today was a session of remarkable technical discipline, especially considering it was a weekly expiry day for Nifty.
The index opened above the PDH with a powerful 280-point Gap Up, placing it directly into the 24,300 ~ 24,333 resistance zone identified in previous notes.
After the opening tick, Nifty witnessed a sharp 207-point dip to fill the gap, finding solid support at the PDH. From there, bulls regained control, breaching the IBH but struggling to cross the Daily Fib 0.786 level (24,250).
The subsequent retracement phases twice tested and held the Daily Fib 0.618 support, providing a launchpad for another charge toward the highs.
Nifty eventually ended the day very close to its peak at 24,286.15 (Adjusted close: 24,261.60), gaining +233.55 points (+0.97%).
The market’s behavior today was a masterclass in respecting structural levels; the “hush and fush” of typical expiry volatility was absent, replaced by a rhythmic movement between Fibonacci levels. The defense of the 0.618 level during mid-day retracements confirmed that buyers were willing to accumulate even at these higher levels.
While the session was calm and predictable, the shadow of the war continues to loom. By forming a Higher High formation on the daily chart, the bulls have kept the recovery narrative alive, though the path ahead remains steep, with the 24,300 ~ 24,333 and 24580 ~ 24610 zone acting as a massive gate that requires sustained volume to truly shatter.
🛡 5 Min Intraday Chart with Levels
📉 Daily Time Frame Chart with Intraday Levels
🕯 Daily Candle Breakdown
Open: 24,280.80
High: 24,303.80
Low: 24,079.95
Close: 24,261.60
Change: +233.55 (+0.97%)
🏗️ Structure Breakdown
Type: Bearish-bodied candle (on an intraday basis) with a massive lower tail.
Range: ≈ 224 points — high volatility.
Body: ≈ 19 points — very small real body, signaling a struggle to close significantly above the open.
Upper Wick: ≈ 23 points — minor resistance encountered at the 24,300 ceiling.
Lower Wick: ≈ 182 points — Aggressive rejection of lower prices, confirming strong demand on the gap-fill.
🛡 5 Min Intraday Chart
⚔️ Gladiator Strategy Update
ATR: 375.32
IB Range: 223.85 → Medium (Relative to ATR)
Market Structure: Imbalanced
Trade Highlights:
10:31 Long Trade: Target Hit (R:R 1:2.56)
12:50 Long Trade: Target Hit (R:R 1:2.24)
Trade Summary: I simply followed the levels today without overthinking. The morning dip to PDH and the 0.618 Fib defense provided clear entries. I’m glad the market respected the zones, which helped me stay calm and reach my targets.
🧱 Support & Resistance Levels
Resistance Zones: 24,300 ~ 24,333 | 24,415 ~ 24,435 | 24,580 ~ 24,610
Support Zones: 24,165 | 24,080 | 23,935
🧠 Final Thoughts
“Technicals provide the map, but news provides the weather.”
We are seeing a constructive Higher High formation, which is a positive sign for the bulls.
However, we are not out of the woods yet. The war front remains unpredictable, and any sudden news could easily derail this recovery.
For the upcoming session, I will cautiously look for upside targets only if the current formation stays intact. The 24,333 and 24415 ~ 24435 level is the main challenge for tomorrow; crossing it could change the landscape, but until then, I will remain practical and trade level-to-level.
✏️ Disclaimer
This is my personal digital diary and represents my own analysis and point of view. It is not financial advice; please consult a professional advisor before making any trading decisions.

Read my blogs here:
substack.com/@kzatakia
Follow me on Telegram:
t.me/swingtraderhub
Follow me on X:
x.com/kzatakia
substack.com/@kzatakia
Follow me on Telegram:
t.me/swingtraderhub
Follow me on X:
x.com/kzatakia
การนำเสนอที่เกี่ยวข้อง
คำจำกัดสิทธิ์ความรับผิดชอบ
ข้อมูลและบทความไม่ได้มีวัตถุประสงค์เพื่อก่อให้เกิดกิจกรรมทางการเงิน, การลงทุน, การซื้อขาย, ข้อเสนอแนะ หรือคำแนะนำประเภทอื่น ๆ ที่ให้หรือรับรองโดย TradingView อ่านเพิ่มเติมใน ข้อกำหนดการใช้งาน
Read my blogs here:
substack.com/@kzatakia
Follow me on Telegram:
t.me/swingtraderhub
Follow me on X:
x.com/kzatakia
substack.com/@kzatakia
Follow me on Telegram:
t.me/swingtraderhub
Follow me on X:
x.com/kzatakia
การนำเสนอที่เกี่ยวข้อง
คำจำกัดสิทธิ์ความรับผิดชอบ
ข้อมูลและบทความไม่ได้มีวัตถุประสงค์เพื่อก่อให้เกิดกิจกรรมทางการเงิน, การลงทุน, การซื้อขาย, ข้อเสนอแนะ หรือคำแนะนำประเภทอื่น ๆ ที่ให้หรือรับรองโดย TradingView อ่านเพิ่มเติมใน ข้อกำหนดการใช้งาน