
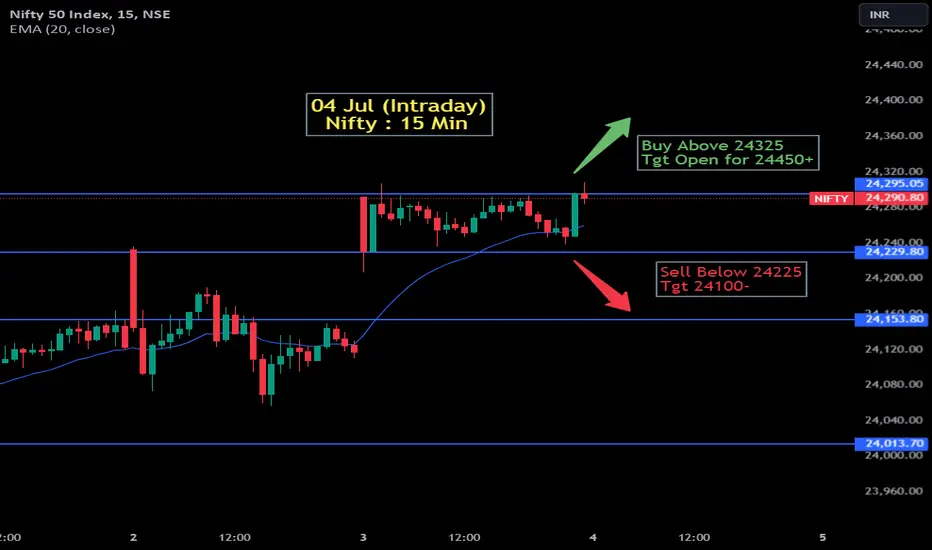
15-minute intraday chart for the Nifty 50 index from a trading view. It includes data and trading strategies for July 4th, 2024. The chart displays price movements with a plotted Exponential Moving Average (EMA). There are strategic points marked for buying and selling:
Buy Signal: The chart suggests buying if the index moves above 24,325 points with a target open for reaching above 24,450 points.
Sell Signal: The chart suggests selling if the index falls below 24,225 points, with a target of reaching around 24,100 points.
Buy Signal: The chart suggests buying if the index moves above 24,325 points with a target open for reaching above 24,450 points.
Sell Signal: The chart suggests selling if the index falls below 24,225 points, with a target of reaching around 24,100 points.

คำจำกัดสิทธิ์ความรับผิดชอบ
ข้อมูลและบทความไม่ได้มีวัตถุประสงค์เพื่อก่อให้เกิดกิจกรรมทางการเงิน, การลงทุน, การซื้อขาย, ข้อเสนอแนะ หรือคำแนะนำประเภทอื่น ๆ ที่ให้หรือรับรองโดย TradingView อ่านเพิ่มเติมใน ข้อกำหนดการใช้งาน
คำจำกัดสิทธิ์ความรับผิดชอบ
ข้อมูลและบทความไม่ได้มีวัตถุประสงค์เพื่อก่อให้เกิดกิจกรรมทางการเงิน, การลงทุน, การซื้อขาย, ข้อเสนอแนะ หรือคำแนะนำประเภทอื่น ๆ ที่ให้หรือรับรองโดย TradingView อ่านเพิ่มเติมใน ข้อกำหนดการใช้งาน