
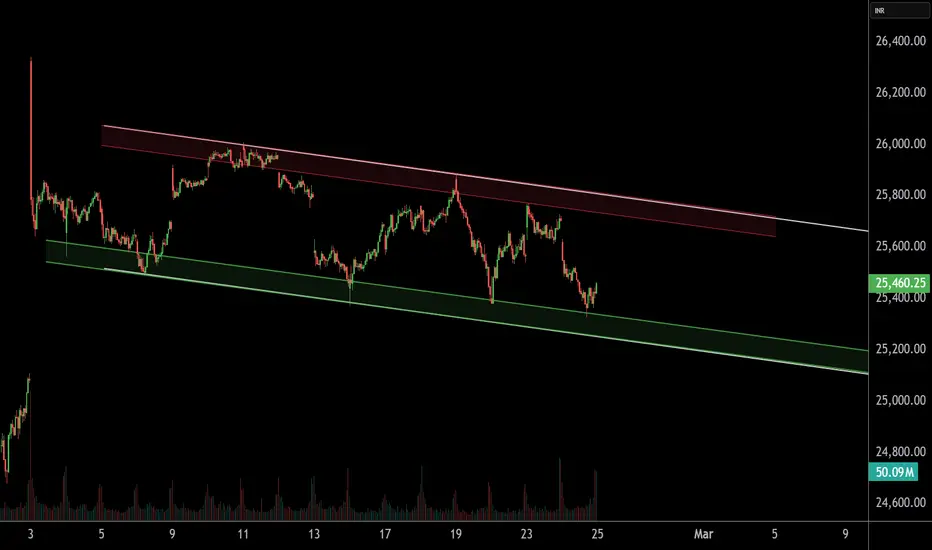
NIFTY 50 – 15-Minute Timeframe Analysis
On the 15-minute chart, NIFTY 50 is currently trading within a falling channel pattern.
Key Support Zone: 25,240 – 25,300
As long as this support zone sustains, we may witness a potential bounce from current levels.
Upside Targets: 25,700 – 25,800
A sustained hold above the support zone could trigger short-term bullish momentum.
THANK YOU !!

@RahulSarawagi
Connect us at optionlab.co.in/
Connect us at optionlab.co.in/
คำจำกัดสิทธิ์ความรับผิดชอบ
ข้อมูลและบทความไม่ได้มีวัตถุประสงค์เพื่อก่อให้เกิดกิจกรรมทางการเงิน, การลงทุน, การซื้อขาย, ข้อเสนอแนะ หรือคำแนะนำประเภทอื่น ๆ ที่ให้หรือรับรองโดย TradingView อ่านเพิ่มเติมใน ข้อกำหนดการใช้งาน
@RahulSarawagi
Connect us at optionlab.co.in/
Connect us at optionlab.co.in/
คำจำกัดสิทธิ์ความรับผิดชอบ
ข้อมูลและบทความไม่ได้มีวัตถุประสงค์เพื่อก่อให้เกิดกิจกรรมทางการเงิน, การลงทุน, การซื้อขาย, ข้อเสนอแนะ หรือคำแนะนำประเภทอื่น ๆ ที่ให้หรือรับรองโดย TradingView อ่านเพิ่มเติมใน ข้อกำหนดการใช้งาน