
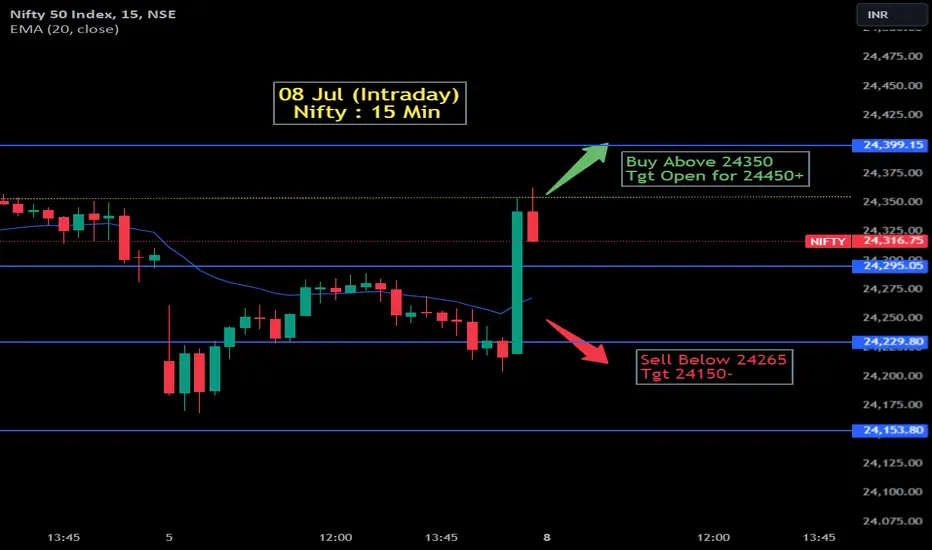
It looks like you have provided a trading chart for Nifty 50 Index with specific trading signals for July 8th. Here are the key details from the chart:
Buy Signal:
-Trigger: Above 24,350
-Target: Open for 24,450+
Sell Signal:
-Trigger: Below 24,265
-Target: 24,150-
The chart uses a 15-minute timeframe and shows the price action along with an EMA (20) indicator.
Buy Signal:
-Trigger: Above 24,350
-Target: Open for 24,450+
Sell Signal:
-Trigger: Below 24,265
-Target: 24,150-
The chart uses a 15-minute timeframe and shows the price action along with an EMA (20) indicator.

คำจำกัดสิทธิ์ความรับผิดชอบ
ข้อมูลและบทความไม่ได้มีวัตถุประสงค์เพื่อก่อให้เกิดกิจกรรมทางการเงิน, การลงทุน, การซื้อขาย, ข้อเสนอแนะ หรือคำแนะนำประเภทอื่น ๆ ที่ให้หรือรับรองโดย TradingView อ่านเพิ่มเติมใน ข้อกำหนดการใช้งาน
คำจำกัดสิทธิ์ความรับผิดชอบ
ข้อมูลและบทความไม่ได้มีวัตถุประสงค์เพื่อก่อให้เกิดกิจกรรมทางการเงิน, การลงทุน, การซื้อขาย, ข้อเสนอแนะ หรือคำแนะนำประเภทอื่น ๆ ที่ให้หรือรับรองโดย TradingView อ่านเพิ่มเติมใน ข้อกำหนดการใช้งาน