
Overview
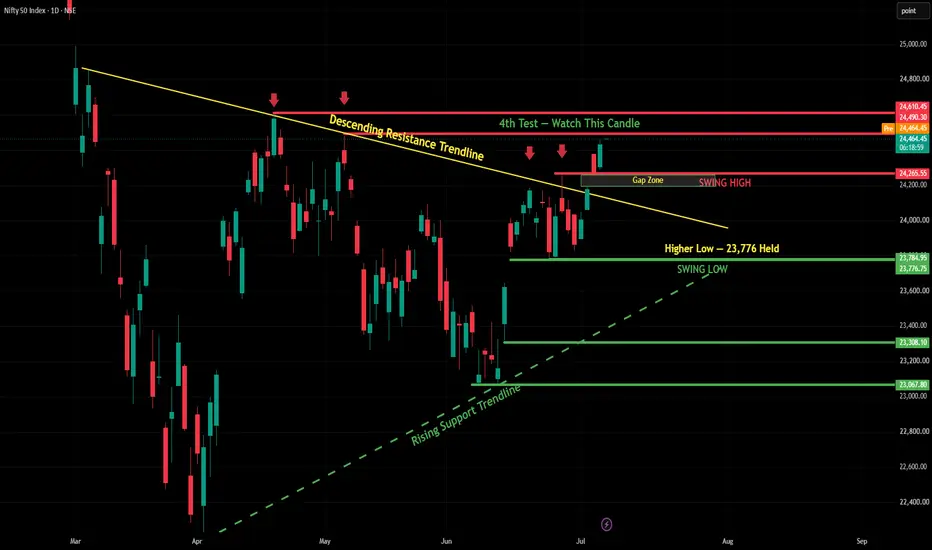
In our previous analysis, we highlighted the Descending Resistance Trendline and the critical 23,776 Higher Low as key structural markers. This week, NIFTY has delivered a significant development — price has broken above the Swing High at 24,265 and is now trading at 24,430, above the descending trendline.
The structure is gradually shifting from bearish to potentially bullish. Here is the updated analysis.
What Changed This Week
📈 Trendline Breakout — Price has now closed above the Descending Resistance Trendline that has been in place since March 2026. This is the first meaningful close above this trendline.
📈 Swing High Cleared — Price broke and closed above 24,265 — the previous Swing High. This confirms the first higher high in the structure.
📈 Higher Low Confirmed — 23,776 held as support, establishing a clear Higher Low structure. Combined with today's Higher High above 24,265, NIFTY is now showing the first signs of a potential trend reversal.
🟡 Gap Zone — A Gap Zone exists between 24,200 and 24,265. This zone now acts as immediate support — any pullback to this area is a natural retest zone.
The Bigger Picture
Two trendlines are now shaping NIFTY's structure:
🔴 Descending Resistance Trendline (yellow) — being broken to the upside currently
🟢 Rising Support Trendline (green dashed) — connecting lows from April through June, providing a rising floor
Together these form a converging structure that is resolving to the upside. The convergence point has been broken bullishly — this is a positive structural development.
Key Levels
🟢 Gap Zone Support — 24,200–24,265
🟢 Higher Low / Swing Low — 23,776
🟢 Rising Support Trendline — dynamic, currently ~23,500
🔴 Resistance 1 — 24,490
🔴 Resistance 2 — 24,610
🔴 Resistance 3 — 24,750
Possible Trade Setup — For Reference Only
This is not a recommendation. Always apply your own analysis and risk management.
For traders monitoring this structure, the Gap Zone between 24,200–24,265 presents a natural reference for a potential long setup if price pulls back and holds:
Watch Zone: 24,200–24,265 (Gap Zone / Previous Swing High retest)
Bullish if: Price holds above 24,200 on a pullback and shows bullish price action
Stop Loss Reference: Below 24,075 (below the Gap Zone)
Target 1: 24,490
Target 2: 24,610
Target 3: 24,750
Risk-Reward: Approximately 1:2 to 1:3
A two-stage approach may suit risk-conscious traders — watching for price action at 24,265 first, then 24,200 as a secondary reference if the first doesn't hold.
Entry timing and position sizing should always be based on your own risk assessment and capital allocation.
A Note on Current Market Context
The Put-Call Ratio (PCR) currently stands at 1.48 — indicating relatively higher put writing, which can sometimes signal that the market is extended in the short term and profit booking at higher levels is possible.
This suggests a buy-on-dip approach may offer a better risk-reward than chasing price at current levels. Waiting for a pullback to the Gap Zone (24,200–24,265) before entering would align with the PCR context — buying strength from a position of support rather than at resistance.
PCR is one data point among many — always combine with price action confirmation.
Three Scenarios
🟢 Scenario A — Bullish Continuation
Price holds above the Gap Zone (24,200–24,265) on any pullback, finds buyers, and continues toward 24,490 and 24,610. The trendline breakout is confirmed and the structural shift is underway.
🔴 Scenario B — False Breakout
Price fails to hold above 24,265 and falls back into the Gap Zone or below. Watch 23,776 as the last line of defence for the bullish structure.
⚪ Scenario C — Consolidation
Price consolidates between 24,265 and 24,490 for a few sessions before the next directional move. In this case wait for a clear breakout above 24,490 with volume before adding conviction.
Beginner's Lesson — What is a Gap Zone?
A Gap Zone forms when price opens significantly above the previous close — leaving an unfilled area on the chart. These zones often act as:
Support on pullbacks — price tends to find buyers in gap zones as they represent a level where demand exceeded supply
Confirmation levels — a gap that holds as support after a breakout adds conviction to the bullish case
Key reference zones — if price falls back into and closes below a gap zone, it weakens the breakout thesis
The Gap Zone between 24,200–24,265 is now the most important level to watch on pullbacks.
Conclusion
NIFTY has broken above the Descending Resistance Trendline and the Swing High at 24,265 — the first meaningful structural shift since the downtrend began in March. The Gap Zone at 24,200–24,265 is now the immediate support reference.
Watch how price behaves on the first pullback — that will confirm whether this breakout is genuine.
For educational purposes only. Not financial advice. Always manage your own risk.
In our previous analysis, we highlighted the Descending Resistance Trendline and the critical 23,776 Higher Low as key structural markers. This week, NIFTY has delivered a significant development — price has broken above the Swing High at 24,265 and is now trading at 24,430, above the descending trendline.
The structure is gradually shifting from bearish to potentially bullish. Here is the updated analysis.
What Changed This Week
📈 Trendline Breakout — Price has now closed above the Descending Resistance Trendline that has been in place since March 2026. This is the first meaningful close above this trendline.
📈 Swing High Cleared — Price broke and closed above 24,265 — the previous Swing High. This confirms the first higher high in the structure.
📈 Higher Low Confirmed — 23,776 held as support, establishing a clear Higher Low structure. Combined with today's Higher High above 24,265, NIFTY is now showing the first signs of a potential trend reversal.
🟡 Gap Zone — A Gap Zone exists between 24,200 and 24,265. This zone now acts as immediate support — any pullback to this area is a natural retest zone.
The Bigger Picture
Two trendlines are now shaping NIFTY's structure:
🔴 Descending Resistance Trendline (yellow) — being broken to the upside currently
🟢 Rising Support Trendline (green dashed) — connecting lows from April through June, providing a rising floor
Together these form a converging structure that is resolving to the upside. The convergence point has been broken bullishly — this is a positive structural development.
Key Levels
🟢 Gap Zone Support — 24,200–24,265
🟢 Higher Low / Swing Low — 23,776
🟢 Rising Support Trendline — dynamic, currently ~23,500
🔴 Resistance 1 — 24,490
🔴 Resistance 2 — 24,610
🔴 Resistance 3 — 24,750
Possible Trade Setup — For Reference Only
This is not a recommendation. Always apply your own analysis and risk management.
For traders monitoring this structure, the Gap Zone between 24,200–24,265 presents a natural reference for a potential long setup if price pulls back and holds:
Watch Zone: 24,200–24,265 (Gap Zone / Previous Swing High retest)
Bullish if: Price holds above 24,200 on a pullback and shows bullish price action
Stop Loss Reference: Below 24,075 (below the Gap Zone)
Target 1: 24,490
Target 2: 24,610
Target 3: 24,750
Risk-Reward: Approximately 1:2 to 1:3
A two-stage approach may suit risk-conscious traders — watching for price action at 24,265 first, then 24,200 as a secondary reference if the first doesn't hold.
Entry timing and position sizing should always be based on your own risk assessment and capital allocation.
A Note on Current Market Context
The Put-Call Ratio (PCR) currently stands at 1.48 — indicating relatively higher put writing, which can sometimes signal that the market is extended in the short term and profit booking at higher levels is possible.
This suggests a buy-on-dip approach may offer a better risk-reward than chasing price at current levels. Waiting for a pullback to the Gap Zone (24,200–24,265) before entering would align with the PCR context — buying strength from a position of support rather than at resistance.
PCR is one data point among many — always combine with price action confirmation.
Three Scenarios
🟢 Scenario A — Bullish Continuation
Price holds above the Gap Zone (24,200–24,265) on any pullback, finds buyers, and continues toward 24,490 and 24,610. The trendline breakout is confirmed and the structural shift is underway.
🔴 Scenario B — False Breakout
Price fails to hold above 24,265 and falls back into the Gap Zone or below. Watch 23,776 as the last line of defence for the bullish structure.
⚪ Scenario C — Consolidation
Price consolidates between 24,265 and 24,490 for a few sessions before the next directional move. In this case wait for a clear breakout above 24,490 with volume before adding conviction.
Beginner's Lesson — What is a Gap Zone?
A Gap Zone forms when price opens significantly above the previous close — leaving an unfilled area on the chart. These zones often act as:
Support on pullbacks — price tends to find buyers in gap zones as they represent a level where demand exceeded supply
Confirmation levels — a gap that holds as support after a breakout adds conviction to the bullish case
Key reference zones — if price falls back into and closes below a gap zone, it weakens the breakout thesis
The Gap Zone between 24,200–24,265 is now the most important level to watch on pullbacks.
Conclusion
NIFTY has broken above the Descending Resistance Trendline and the Swing High at 24,265 — the first meaningful structural shift since the downtrend began in March. The Gap Zone at 24,200–24,265 is now the immediate support reference.
Watch how price behaves on the first pullback — that will confirm whether this breakout is genuine.
For educational purposes only. Not financial advice. Always manage your own risk.

📈 HK Trading Community | Market Structure & Indicator Updates
Telegram: t.me/trendstrike1000
Website: quantumedgepro.netlify.app/
chat.whatsapp.com/E3FM7UZ5Gxo8OFsaRJc9hF
Telegram: t.me/trendstrike1000
Website: quantumedgepro.netlify.app/
chat.whatsapp.com/E3FM7UZ5Gxo8OFsaRJc9hF
การนำเสนอที่เกี่ยวข้อง
คำจำกัดสิทธิ์ความรับผิดชอบ
ข้อมูลและบทความไม่ได้มีวัตถุประสงค์เพื่อก่อให้เกิดกิจกรรมทางการเงิน, การลงทุน, การซื้อขาย, ข้อเสนอแนะ หรือคำแนะนำประเภทอื่น ๆ ที่ให้หรือรับรองโดย TradingView อ่านเพิ่มเติมใน ข้อกำหนดการใช้งาน
📈 HK Trading Community | Market Structure & Indicator Updates
Telegram: t.me/trendstrike1000
Website: quantumedgepro.netlify.app/
chat.whatsapp.com/E3FM7UZ5Gxo8OFsaRJc9hF
Telegram: t.me/trendstrike1000
Website: quantumedgepro.netlify.app/
chat.whatsapp.com/E3FM7UZ5Gxo8OFsaRJc9hF
การนำเสนอที่เกี่ยวข้อง
คำจำกัดสิทธิ์ความรับผิดชอบ
ข้อมูลและบทความไม่ได้มีวัตถุประสงค์เพื่อก่อให้เกิดกิจกรรมทางการเงิน, การลงทุน, การซื้อขาย, ข้อเสนอแนะ หรือคำแนะนำประเภทอื่น ๆ ที่ให้หรือรับรองโดย TradingView อ่านเพิ่มเติมใน ข้อกำหนดการใช้งาน