
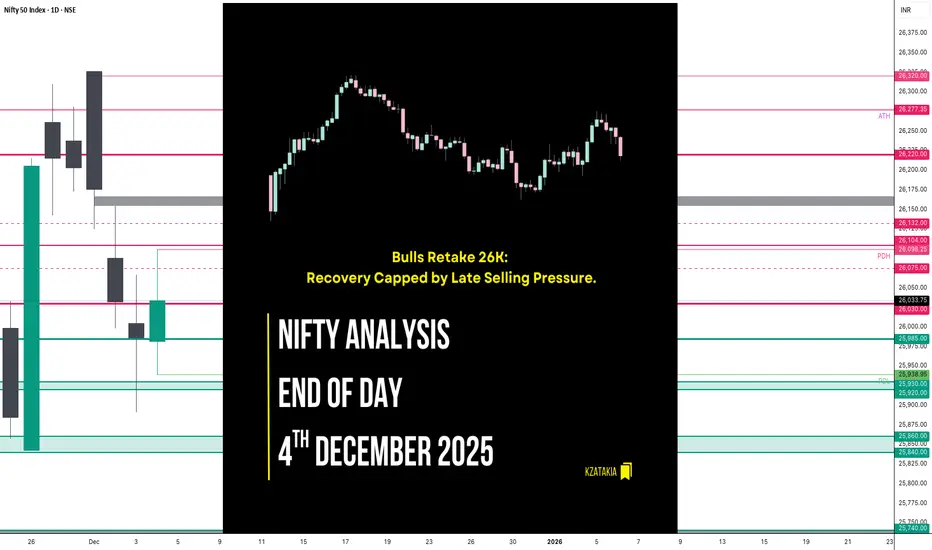
🟢 Nifty Analysis EOD – December 4, 2025 – Thursday 🔴
Bulls Retake 26K: Recovery Capped by Late Selling Pressure.
🗞 Nifty Summary
The session began flat, immediately plunging 50 points to mark the day low at 25,938.95. The subsequent recovery was swift and confident, successfully pushing the Nifty above the initial resistance at 26030 and completing the Initial Balance (IB) formation.
The index then methodically climbed through 26075, PDH, and 26104. Bulls tried hard to sustain above the PDH but failed, leading to a sharp fallback below 25985 and the PDC.
After another strong, 100-point recovery attempt failed to reclaim the PDH, the day concluded with a surprise element: sharp selling in Reliance (2% fall within last 30 minutes) wiped out 50 points in the last 30 minutes.
Despite this late pressure, the Nifty closed successfully at 26,010.35, securing a close above the psychological 26K level. The day was full of action, showing strong territorial fighting from both sides.
🛡 5 Min Intraday Chart with Levels

🛡 Intraday Walk
The initial market weakness was quickly negated by strong buyers at 25938, turning the early move into a deep lower wick.
The strong recovery confirmed demand below 26K. The most crucial structural failure occurred when Nifty broke 26104 but could not hold it, showing overhead supply at that level. This failure indicates that while bulls are defending 26K, they lack the conviction for a sustained breakout.
The final sharp sell-off, attributed primarily to a major heavyweight stock (Reliance), dragged the closing price lower, but the close above 26K remains a small victory for the bulls.
📉 Daily Time Frame Chart with Intraday Levels

🕯 Daily Candle Breakdown
Open: 25,981.85
High: 26,098.25
Low: 25,938.95
Close: 26,033.75
Change: +47.75 (+0.18%)
🏗️ Structure Breakdown
Type: Bullish candle with a moderately long upper wick.
Range (High–Low): ≈ 159 points — demonstrating moderate intraday movement.
Body: ≈ 52 points — reflecting controlled upside strength.
Upper Wick: ≈ 64 points — indicates that buyers attempted a breakout but faced significant resistance near the highs (26,100).
Lower Wick: ≈ 43 points — confirms buyers protected the lower levels early in the session.
📚 Interpretation
The candle is bullish, confirming a successful defense of the 25930 ~ 25920 zone. However, the long upper wick is a warning signal, showing strong supply near 26,100. The overall structure suggests that while bulls are fighting back, they are meeting strong resistance at critical breakout levels. The successful close above the 26K psychological level is the primary positive takeaway.
🕯 Candle Type
Bullish Candle with Upper-Wick Resistance — Upside continuation requires clearing the 26100 resistance decisively.
🛡 5 Min Intraday Chart

⚔️ Gladiator Strategy Update
ATR: 189.97
IB Range: 97.4 → Medium
Market Structure: Balanced
Trade Highlights:
10:07 Long Trade - Target Hit (R:R 1:1.74) (IBH + Resistance Breakout)
12:05 Long Trade - SL Hit (IBH + Resistance Breakout)
Trade Summary: The strategy capitalized on the strong morning recovery from the day’s low, securing an early long target. However, the unexpected high-level rejection and subsequent choppy price action around the PDH resulted in the second trade hitting its stop loss.
🧱 Support & Resistance Levels
Resistance Zones:
26030 ~ 26075
26104
26132 ~ 26160
26220
Support Zones:
25985
25930 ~ 25920 (Immediate Base)
🧠 Final Thoughts
“The fight for 26100 defines the week.”
The market is holding above 26K, which is positive, but the strong selling near 26100 shows bears remain active. For tomorrow’s session, bulls must breach the 26160 gap zone and secure a close above 26100 to maintain bullish momentum. Failure to do so could lead to a re-test of the 25985 support.
✏️ Disclaimer
This is just my personal viewpoint. Always consult your financial advisor before taking any action.
Bulls Retake 26K: Recovery Capped by Late Selling Pressure.
🗞 Nifty Summary
The session began flat, immediately plunging 50 points to mark the day low at 25,938.95. The subsequent recovery was swift and confident, successfully pushing the Nifty above the initial resistance at 26030 and completing the Initial Balance (IB) formation.
The index then methodically climbed through 26075, PDH, and 26104. Bulls tried hard to sustain above the PDH but failed, leading to a sharp fallback below 25985 and the PDC.
After another strong, 100-point recovery attempt failed to reclaim the PDH, the day concluded with a surprise element: sharp selling in Reliance (2% fall within last 30 minutes) wiped out 50 points in the last 30 minutes.
Despite this late pressure, the Nifty closed successfully at 26,010.35, securing a close above the psychological 26K level. The day was full of action, showing strong territorial fighting from both sides.
🛡 5 Min Intraday Chart with Levels
🛡 Intraday Walk
The initial market weakness was quickly negated by strong buyers at 25938, turning the early move into a deep lower wick.
The strong recovery confirmed demand below 26K. The most crucial structural failure occurred when Nifty broke 26104 but could not hold it, showing overhead supply at that level. This failure indicates that while bulls are defending 26K, they lack the conviction for a sustained breakout.
The final sharp sell-off, attributed primarily to a major heavyweight stock (Reliance), dragged the closing price lower, but the close above 26K remains a small victory for the bulls.
📉 Daily Time Frame Chart with Intraday Levels
🕯 Daily Candle Breakdown
Open: 25,981.85
High: 26,098.25
Low: 25,938.95
Close: 26,033.75
Change: +47.75 (+0.18%)
🏗️ Structure Breakdown
Type: Bullish candle with a moderately long upper wick.
Range (High–Low): ≈ 159 points — demonstrating moderate intraday movement.
Body: ≈ 52 points — reflecting controlled upside strength.
Upper Wick: ≈ 64 points — indicates that buyers attempted a breakout but faced significant resistance near the highs (26,100).
Lower Wick: ≈ 43 points — confirms buyers protected the lower levels early in the session.
📚 Interpretation
The candle is bullish, confirming a successful defense of the 25930 ~ 25920 zone. However, the long upper wick is a warning signal, showing strong supply near 26,100. The overall structure suggests that while bulls are fighting back, they are meeting strong resistance at critical breakout levels. The successful close above the 26K psychological level is the primary positive takeaway.
🕯 Candle Type
Bullish Candle with Upper-Wick Resistance — Upside continuation requires clearing the 26100 resistance decisively.
🛡 5 Min Intraday Chart
⚔️ Gladiator Strategy Update
ATR: 189.97
IB Range: 97.4 → Medium
Market Structure: Balanced
Trade Highlights:
10:07 Long Trade - Target Hit (R:R 1:1.74) (IBH + Resistance Breakout)
12:05 Long Trade - SL Hit (IBH + Resistance Breakout)
Trade Summary: The strategy capitalized on the strong morning recovery from the day’s low, securing an early long target. However, the unexpected high-level rejection and subsequent choppy price action around the PDH resulted in the second trade hitting its stop loss.
🧱 Support & Resistance Levels
Resistance Zones:
26030 ~ 26075
26104
26132 ~ 26160
26220
Support Zones:
25985
25930 ~ 25920 (Immediate Base)
🧠 Final Thoughts
“The fight for 26100 defines the week.”
The market is holding above 26K, which is positive, but the strong selling near 26100 shows bears remain active. For tomorrow’s session, bulls must breach the 26160 gap zone and secure a close above 26100 to maintain bullish momentum. Failure to do so could lead to a re-test of the 25985 support.
✏️ Disclaimer
This is just my personal viewpoint. Always consult your financial advisor before taking any action.

Read my blogs here:
substack.com/@kzatakia
Follow me on Telegram:
t.me/swingtraderhub
Follow me on X:
x.com/kzatakia
substack.com/@kzatakia
Follow me on Telegram:
t.me/swingtraderhub
Follow me on X:
x.com/kzatakia
การนำเสนอที่เกี่ยวข้อง
คำจำกัดสิทธิ์ความรับผิดชอบ
ข้อมูลและบทความไม่ได้มีวัตถุประสงค์เพื่อก่อให้เกิดกิจกรรมทางการเงิน, การลงทุน, การซื้อขาย, ข้อเสนอแนะ หรือคำแนะนำประเภทอื่น ๆ ที่ให้หรือรับรองโดย TradingView อ่านเพิ่มเติมใน ข้อกำหนดการใช้งาน
Read my blogs here:
substack.com/@kzatakia
Follow me on Telegram:
t.me/swingtraderhub
Follow me on X:
x.com/kzatakia
substack.com/@kzatakia
Follow me on Telegram:
t.me/swingtraderhub
Follow me on X:
x.com/kzatakia
การนำเสนอที่เกี่ยวข้อง
คำจำกัดสิทธิ์ความรับผิดชอบ
ข้อมูลและบทความไม่ได้มีวัตถุประสงค์เพื่อก่อให้เกิดกิจกรรมทางการเงิน, การลงทุน, การซื้อขาย, ข้อเสนอแนะ หรือคำแนะนำประเภทอื่น ๆ ที่ให้หรือรับรองโดย TradingView อ่านเพิ่มเติมใน ข้อกำหนดการใช้งาน