
Hello Traders,
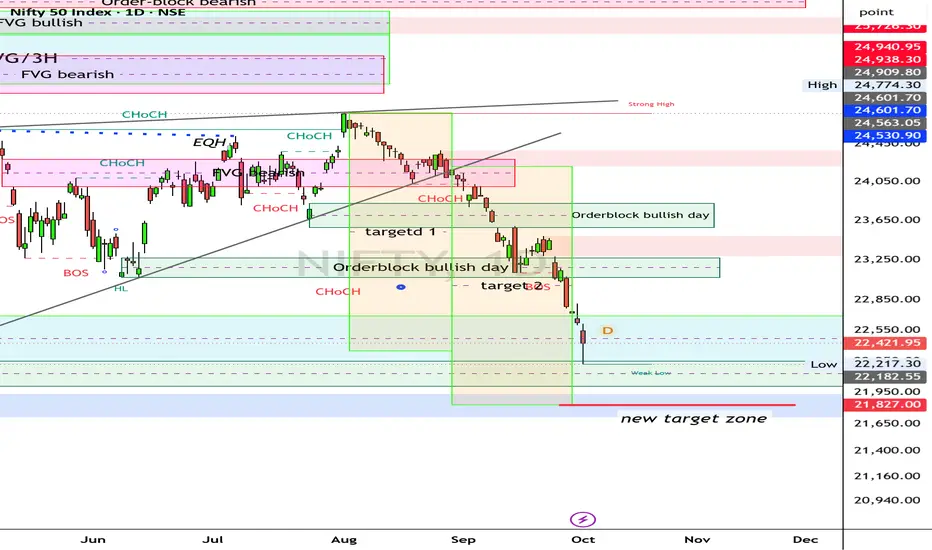
the NIFTY50 has dropped into my price area (target-zone) of roughly about 22217 point (basis daily low) and popped up to a closing price level of 22422 points. It also establisged a gap-down, left by trading on Thusday 01th . Probably a „Morning star“ may appear by trading on Monday, but this is just an idea.
The bears need to watch the area of 22182 point. If this level should past for new (intra) day lows, the door is open to more weakness ahead. I extend my price target to the downside to 21743 points. Here, a so called „strong low“ is established. The indicators as „MoM“ (Momentum) shows more weakness ahead, RSI is still dropping lower and shows no trend for buying pressure.
Recall! I have shown you two ways to measure a decline (i. e. advance) of a drop, in this case, to the downside. First was to draw a line (rectangle) to the widest open of the pattern and copy it to the end of the advance. On a daily close the target has been hit and achived! →Touch down!
The second way was to copy the line/rectangle to the drop off the pattern and check the target. This target has much room to go and should be achived @21800 points!
So, as before. A decline below Thursday's low on a daily closing price opens the door to more weakness and the new target range probably should be achived.
We will check the pattern, if so to come, by the next 2-3 trading days and update the chart once again.
You, my loyal follower, have been prepaired for this scenario many weeks before it happend and this is a high value advance!
Have a great week.....
Ruebennase
Please ask or comment as appropriate.
Trade on this analysis at your own risk
the NIFTY50 has dropped into my price area (target-zone) of roughly about 22217 point (basis daily low) and popped up to a closing price level of 22422 points. It also establisged a gap-down, left by trading on Thusday 01th . Probably a „Morning star“ may appear by trading on Monday, but this is just an idea.
The bears need to watch the area of 22182 point. If this level should past for new (intra) day lows, the door is open to more weakness ahead. I extend my price target to the downside to 21743 points. Here, a so called „strong low“ is established. The indicators as „MoM“ (Momentum) shows more weakness ahead, RSI is still dropping lower and shows no trend for buying pressure.
Recall! I have shown you two ways to measure a decline (i. e. advance) of a drop, in this case, to the downside. First was to draw a line (rectangle) to the widest open of the pattern and copy it to the end of the advance. On a daily close the target has been hit and achived! →Touch down!
The second way was to copy the line/rectangle to the drop off the pattern and check the target. This target has much room to go and should be achived @21800 points!
So, as before. A decline below Thursday's low on a daily closing price opens the door to more weakness and the new target range probably should be achived.
We will check the pattern, if so to come, by the next 2-3 trading days and update the chart once again.
You, my loyal follower, have been prepaired for this scenario many weeks before it happend and this is a high value advance!
Have a great week.....
Ruebennase
Please ask or comment as appropriate.
Trade on this analysis at your own risk

คำจำกัดสิทธิ์ความรับผิดชอบ
ข้อมูลและบทความไม่ได้มีวัตถุประสงค์เพื่อก่อให้เกิดกิจกรรมทางการเงิน, การลงทุน, การซื้อขาย, ข้อเสนอแนะ หรือคำแนะนำประเภทอื่น ๆ ที่ให้หรือรับรองโดย TradingView อ่านเพิ่มเติมใน ข้อกำหนดการใช้งาน
คำจำกัดสิทธิ์ความรับผิดชอบ
ข้อมูลและบทความไม่ได้มีวัตถุประสงค์เพื่อก่อให้เกิดกิจกรรมทางการเงิน, การลงทุน, การซื้อขาย, ข้อเสนอแนะ หรือคำแนะนำประเภทอื่น ๆ ที่ให้หรือรับรองโดย TradingView อ่านเพิ่มเติมใน ข้อกำหนดการใช้งาน