
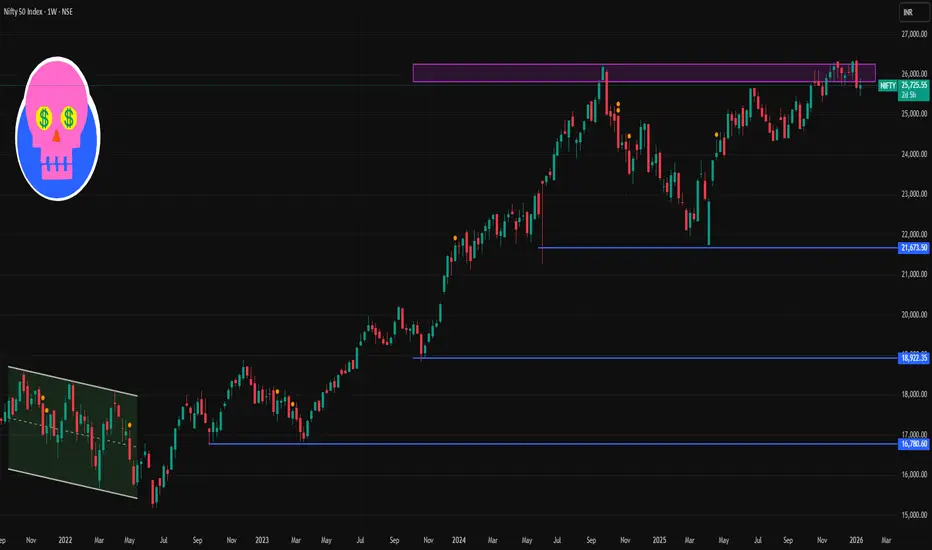
📌 Current Weekly Price (Live)
Nifty 50 approx ~25,730–25,740 (latest live level) — slight downside bias today.
📈 Weekly Resistance Levels (Upside)
1. 25,900 – 26,000 zone
• Immediate resistance above current price — key psychological barrier.
2. 26,100 – 26,200 zone
• Strong technical resistance (previous weekly highs & upper band).
3. 26,300+
• If breakout above 26,200 sustains, next upper resistance.
📉 Weekly Support Levels (Downside)
1. 25,600–25,650
• Near-term support from recent weekly structure.
2. 25,300–25,350
• Secondary support; zone where price has bounced previously on weekly charts.
3. 24,800–24,700
• Major structural support — breach here opens deeper correction risk.
📊 Weekly Technical Range to Watch
Neutral/Range-Bound View (Weekly):
⬆️ Bullish: Break & weekly close above 26,000–26,200
⬇️ Bearish: Break & close below 25,300–25,350
Between these levels, the index may consolidate before a clear directional move.
📌 Summary Weekly Levels (2026)
Resistance Zones
• 26,000 (key psychological)
• 26,100–26,200 (secondary)
• 26,300+ (extended)
Support Zones
• 25,600–25,650 (immediate)
• 25,300–25,350 (secondary)
• 24,800–24,700 (major)

Contact Knowledgehub for a detailed consultation: Dm on WhatsApp: [wa.link/a2o0kz]-
Phone No: [+91 93102 26243]-
Email: [tradingviewknowledgehub@gmail.com]---
-- Let’s achieve success together!
Phone No: [+91 93102 26243]-
Email: [tradingviewknowledgehub@gmail.com]---
-- Let’s achieve success together!
การนำเสนอที่เกี่ยวข้อง
คำจำกัดสิทธิ์ความรับผิดชอบ
ข้อมูลและบทความไม่ได้มีวัตถุประสงค์เพื่อก่อให้เกิดกิจกรรมทางการเงิน, การลงทุน, การซื้อขาย, ข้อเสนอแนะ หรือคำแนะนำประเภทอื่น ๆ ที่ให้หรือรับรองโดย TradingView อ่านเพิ่มเติมใน ข้อกำหนดการใช้งาน