The Nifty Alpha 50  NIFTYALPHA50 Index is a prominent instrument for investors chasing alpha. It is a benchmark index that tracks the performance of 50 stocks with high alpha over the last one year. Historically, it is observed that the Nifty Alpha 50 Index has offered better returns to investors as compared to the flagship indices.
The advantage of the index lies not only in its diversification across different sectors but also in its diversification across large, mid, and small-cap companies. Thus, the index eliminates unsystematic risk while favouring merit over concentration.
However, investors cannot hedge the instrument (during a crisis) as it is not listed for derivatives trading. Systematic risk is still a factor to be considered. Thus, investors have to take the path of exchange-traded funds (ETFs) and mutual funds (MFs) machinery to build long positions.
Breakout: Adam-&-Eve Double Bottom Pattern
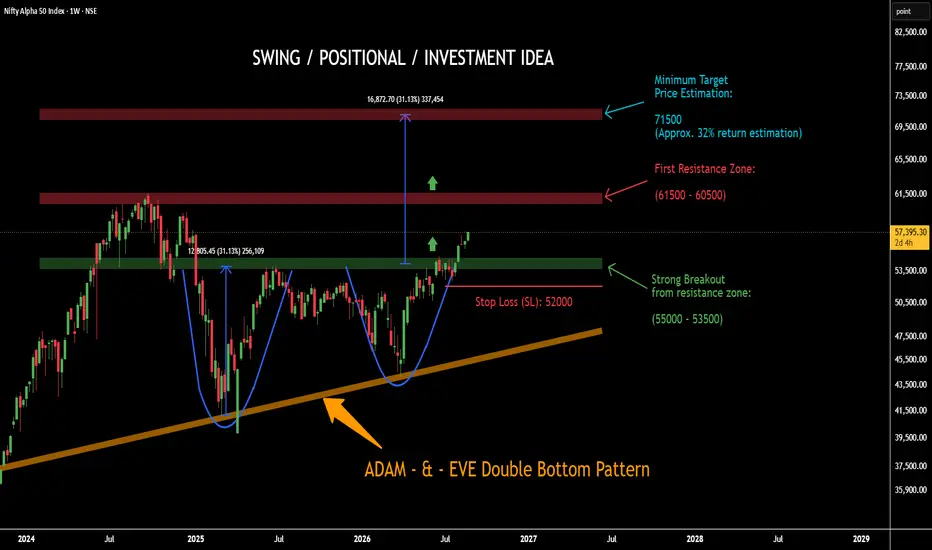
The recent sustainable breakout of the Nifty Alpha 50 Index from an observable "Adam-&-Eve Double Bottom" pattern is a sign of the start of the new bull phase. Probably, the index is out of the sideways consolidation. Thus, the index might be considered for a swing, positional, or investment bet.
Strong Support Zone (SSZ): (55000 - 53500)
Stay bullish above the SSZ.
First Resistance Zone: (61500 - 60500)
In its first bullish impulse out of the consolidation, the first resistance area will be in the zone (61500 - 60500). The price might pause for a while in this region. The zone is near its previous high. If the price decisively breaks out of its first resistance zone, then more bullish impulse will be observed. Investors can increase their position size above 61500.
TARGET ESTIMATION: 71500
It is estimated that the index might offer approximately a 32% return in the future, considering its sustainable breakout from the Adam-&-Eve Double Bottom pattern.
STOP LOSS (SL): 52000
Markets are uncertain. Anything can happen in the markets. The swing and positional traders going long in the security must decide a stop loss (SL) level before entering. The stop loss level is 52000. In case the price decisively breaks down below 52000, the swing and positional traders should book the loss with humility.
● Disclaimer + End Note
- All the analyses would fail in the case of a major gap up, gap down, or price structure anomaly. Thus, practice PRAGMATISM in the live session.
- Trade only if there is a set-up. Remember, not trading is an extension of the trading activity.
- Mark your points. Trade your points. Price is GOD. Anything can happen in the markets. Thus, trade what you see, not what you believe.
- Always PRACTICE RISK MANAGEMENT. Always PROTECT YOUR CAPITAL. Be RESPONSIBLE.
- The post is purely based on technical and chart analysis. The author has not studied the fundamentals. Thus, any fundamental or macroeconomic event can disrupt chart analysis.
- The author has no intention to promote buy or sell recommendations.
- The post is only for educational purposes.
- The intent of the post surrounds trading levels as well as an investment idea.
- Novice traders should stick to the cash segment for swing trading instead of F&O. This post has no intention to promote F&O trading.
- Please be mindful during trading and investment decisions. Be Responsible.
- Be Strategic. Be Courageous. Be Patient. Be Wise.
- Every day is a new day. Thus, do not carry the baggage of past successes or failures. Leave the gardens of winning and losing. Establish yourself in equanimity. Always think from a new perspective.
- Let the joy of trading drive your effectiveness, not greed or fear. Believe in Possibilities.
Happy Trading!
NIFTYALPHA50 Index is a prominent instrument for investors chasing alpha. It is a benchmark index that tracks the performance of 50 stocks with high alpha over the last one year. Historically, it is observed that the Nifty Alpha 50 Index has offered better returns to investors as compared to the flagship indices. The advantage of the index lies not only in its diversification across different sectors but also in its diversification across large, mid, and small-cap companies. Thus, the index eliminates unsystematic risk while favouring merit over concentration.
However, investors cannot hedge the instrument (during a crisis) as it is not listed for derivatives trading. Systematic risk is still a factor to be considered. Thus, investors have to take the path of exchange-traded funds (ETFs) and mutual funds (MFs) machinery to build long positions.
Breakout: Adam-&-Eve Double Bottom Pattern
The recent sustainable breakout of the Nifty Alpha 50 Index from an observable "Adam-&-Eve Double Bottom" pattern is a sign of the start of the new bull phase. Probably, the index is out of the sideways consolidation. Thus, the index might be considered for a swing, positional, or investment bet.
Strong Support Zone (SSZ): (55000 - 53500)
Stay bullish above the SSZ.
First Resistance Zone: (61500 - 60500)
In its first bullish impulse out of the consolidation, the first resistance area will be in the zone (61500 - 60500). The price might pause for a while in this region. The zone is near its previous high. If the price decisively breaks out of its first resistance zone, then more bullish impulse will be observed. Investors can increase their position size above 61500.
TARGET ESTIMATION: 71500
It is estimated that the index might offer approximately a 32% return in the future, considering its sustainable breakout from the Adam-&-Eve Double Bottom pattern.
STOP LOSS (SL): 52000
Markets are uncertain. Anything can happen in the markets. The swing and positional traders going long in the security must decide a stop loss (SL) level before entering. The stop loss level is 52000. In case the price decisively breaks down below 52000, the swing and positional traders should book the loss with humility.
● Disclaimer + End Note
- All the analyses would fail in the case of a major gap up, gap down, or price structure anomaly. Thus, practice PRAGMATISM in the live session.
- Trade only if there is a set-up. Remember, not trading is an extension of the trading activity.
- Mark your points. Trade your points. Price is GOD. Anything can happen in the markets. Thus, trade what you see, not what you believe.
- Always PRACTICE RISK MANAGEMENT. Always PROTECT YOUR CAPITAL. Be RESPONSIBLE.
- The post is purely based on technical and chart analysis. The author has not studied the fundamentals. Thus, any fundamental or macroeconomic event can disrupt chart analysis.
- The author has no intention to promote buy or sell recommendations.
- The post is only for educational purposes.
- The intent of the post surrounds trading levels as well as an investment idea.
- Novice traders should stick to the cash segment for swing trading instead of F&O. This post has no intention to promote F&O trading.
- Please be mindful during trading and investment decisions. Be Responsible.
- Be Strategic. Be Courageous. Be Patient. Be Wise.
- Every day is a new day. Thus, do not carry the baggage of past successes or failures. Leave the gardens of winning and losing. Establish yourself in equanimity. Always think from a new perspective.
- Let the joy of trading drive your effectiveness, not greed or fear. Believe in Possibilities.
Happy Trading!

คำจำกัดสิทธิ์ความรับผิดชอบ
ข้อมูลและบทความไม่ได้มีวัตถุประสงค์เพื่อก่อให้เกิดกิจกรรมทางการเงิน, การลงทุน, การซื้อขาย, ข้อเสนอแนะ หรือคำแนะนำประเภทอื่น ๆ ที่ให้หรือรับรองโดย TradingView อ่านเพิ่มเติมใน ข้อกำหนดการใช้งาน
คำจำกัดสิทธิ์ความรับผิดชอบ
ข้อมูลและบทความไม่ได้มีวัตถุประสงค์เพื่อก่อให้เกิดกิจกรรมทางการเงิน, การลงทุน, การซื้อขาย, ข้อเสนอแนะ หรือคำแนะนำประเภทอื่น ๆ ที่ให้หรือรับรองโดย TradingView อ่านเพิ่มเติมใน ข้อกำหนดการใช้งาน