
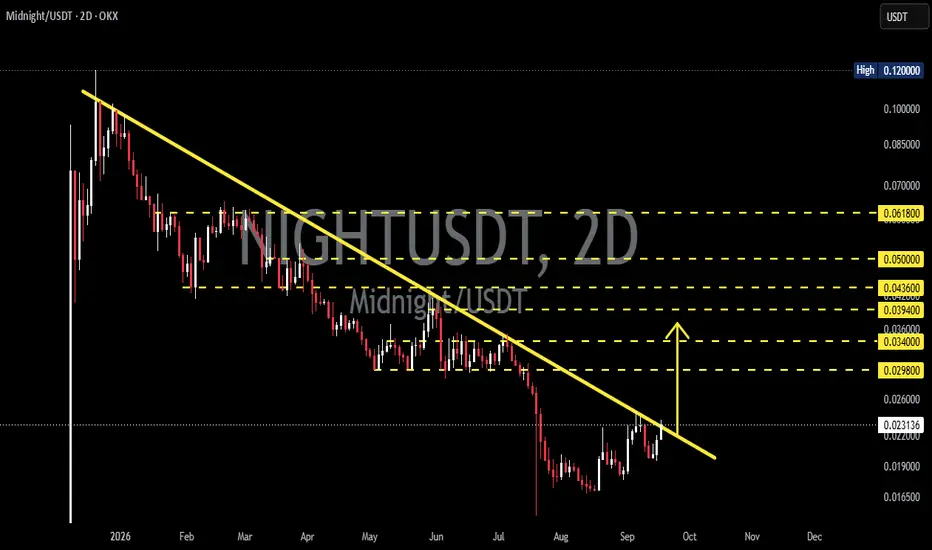
$NIGHT chart on the 2D timeframe shows a price structure that remains within a downtrend. Since the peak around $0.10–$0.11, price has formed a series of lower highs, which are connected by the yellow Descending TrendLine.
Currently, price is trading around $0.0231 and is approaching the Descending TrendLine, making this an important area to determine whether price can break out or face another rejection.
---
📐 Pattern: Descending TrendLine
🔻 A Descending TrendLine is formed by connecting multiple lower highs during a downtrend.
📉 As long as price remains below the trendline, the technical market structure continues to indicate bearish pressure.
📐 This trendline acts as a dynamic resistance. The more frequently price tests the trendline without successfully breaking above it, the more significant the level becomes in determining the next potential direction.
📌 However, the trendline is not an absolute resistance. Candle-close confirmation and volume are still important to validate a breakout.
---
🟢 Bullish Scenario — Breakout
🚀 The bullish scenario begins to gain confirmation if MIDNIGHT successfully breaks above the Descending TrendLine and closes above it.
📈 Such a breakout could indicate that selling pressure from the trendline is weakening and that the price structure may begin entering a recovery / potential trend-reversal phase.
🎯 If the breakout is confirmed, the next horizontal resistance levels to watch are:
🎯 $0.0298
🎯 $0.0340
🎯 $0.0394
🎯 $0.0436
🎯 $0.0500
🎯 $0.0618
🔥 The $0.0298–$0.0340 area is an important zone to monitor to determine whether the breakout can develop into stronger bullish momentum.
---
🔴 Bearish Scenario — Rejection
⚠️ If price is rejected again by the Descending TrendLine, the bearish structure remains valid.
📉 A rejection from the trendline could indicate that sellers are still defending this dynamic resistance.
🔻 If price subsequently loses the nearby support area and forms another lower low, bearish pressure could continue.
💥 In that scenario, the previous low area around $0.0165–$0.0190 becomes an important zone to monitor on the chart.
---
🧭 Current Market Structure
🔴 Trend: Bearish / Downtrend
📉 Structure: Lower Highs & Lower Lows
📐 Dynamic Resistance: Descending TrendLine
⚔️ Critical Zone: Around $0.023–$0.024
🟢 Bullish Confirmation: Break & close above the trendline
🔴 Bearish Confirmation: Rejection + support breakdown
🎯 Upside Levels: $0.0298 → $0.0340 → $0.0394 → $0.0436 → $0.0500 → $0.0618
📝 Conclusion
MIDNIGHT is currently approaching an important decision point, as price is testing the Descending TrendLine that has been pressuring the price for several months.
🚀 A breakout and close above the trendline could provide an early indication of a structural shift and open the possibility of a move toward the next resistance levels.
🔻 On the other hand, a rejection from the trendline would keep the bearish structure intact and bring the previous low area back into focus.
⏳ Since the chart uses the 2D timeframe, candle-close confirmation carries greater significance than simply relying on an intraday wick or temporary breakout.
#MIDNIGHT #MIDNIGHTUSDT #Crypto
Currently, price is trading around $0.0231 and is approaching the Descending TrendLine, making this an important area to determine whether price can break out or face another rejection.
---
📐 Pattern: Descending TrendLine
🔻 A Descending TrendLine is formed by connecting multiple lower highs during a downtrend.
📉 As long as price remains below the trendline, the technical market structure continues to indicate bearish pressure.
📐 This trendline acts as a dynamic resistance. The more frequently price tests the trendline without successfully breaking above it, the more significant the level becomes in determining the next potential direction.
📌 However, the trendline is not an absolute resistance. Candle-close confirmation and volume are still important to validate a breakout.
---
🟢 Bullish Scenario — Breakout
🚀 The bullish scenario begins to gain confirmation if MIDNIGHT successfully breaks above the Descending TrendLine and closes above it.
📈 Such a breakout could indicate that selling pressure from the trendline is weakening and that the price structure may begin entering a recovery / potential trend-reversal phase.
🎯 If the breakout is confirmed, the next horizontal resistance levels to watch are:
🎯 $0.0298
🎯 $0.0340
🎯 $0.0394
🎯 $0.0436
🎯 $0.0500
🎯 $0.0618
🔥 The $0.0298–$0.0340 area is an important zone to monitor to determine whether the breakout can develop into stronger bullish momentum.
---
🔴 Bearish Scenario — Rejection
⚠️ If price is rejected again by the Descending TrendLine, the bearish structure remains valid.
📉 A rejection from the trendline could indicate that sellers are still defending this dynamic resistance.
🔻 If price subsequently loses the nearby support area and forms another lower low, bearish pressure could continue.
💥 In that scenario, the previous low area around $0.0165–$0.0190 becomes an important zone to monitor on the chart.
---
🧭 Current Market Structure
🔴 Trend: Bearish / Downtrend
📉 Structure: Lower Highs & Lower Lows
📐 Dynamic Resistance: Descending TrendLine
⚔️ Critical Zone: Around $0.023–$0.024
🟢 Bullish Confirmation: Break & close above the trendline
🔴 Bearish Confirmation: Rejection + support breakdown
🎯 Upside Levels: $0.0298 → $0.0340 → $0.0394 → $0.0436 → $0.0500 → $0.0618
📝 Conclusion
MIDNIGHT is currently approaching an important decision point, as price is testing the Descending TrendLine that has been pressuring the price for several months.
🚀 A breakout and close above the trendline could provide an early indication of a structural shift and open the possibility of a move toward the next resistance levels.
🔻 On the other hand, a rejection from the trendline would keep the bearish structure intact and bring the previous low area back into focus.
⏳ Since the chart uses the 2D timeframe, candle-close confirmation carries greater significance than simply relying on an intraday wick or temporary breakout.
#MIDNIGHT #MIDNIGHTUSDT #Crypto

✅ Get Free Signals! Join Our Telegram Channel Here: t.me/TheCryptoNuclear
✅ Twitter: twitter.com/crypto_nuclear
✅ Join Bybit : partner.bybit.com/b/nuclearvip
✅ Benefits : Lifetime Trading Fee Discount -50%
✅ Twitter: twitter.com/crypto_nuclear
✅ Join Bybit : partner.bybit.com/b/nuclearvip
✅ Benefits : Lifetime Trading Fee Discount -50%
คำจำกัดสิทธิ์ความรับผิดชอบ
ข้อมูลและบทความไม่ได้มีวัตถุประสงค์เพื่อก่อให้เกิดกิจกรรมทางการเงิน, การลงทุน, การซื้อขาย, ข้อเสนอแนะ หรือคำแนะนำประเภทอื่น ๆ ที่ให้หรือรับรองโดย TradingView อ่านเพิ่มเติมใน ข้อกำหนดการใช้งาน
✅ Get Free Signals! Join Our Telegram Channel Here: t.me/TheCryptoNuclear
✅ Twitter: twitter.com/crypto_nuclear
✅ Join Bybit : partner.bybit.com/b/nuclearvip
✅ Benefits : Lifetime Trading Fee Discount -50%
✅ Twitter: twitter.com/crypto_nuclear
✅ Join Bybit : partner.bybit.com/b/nuclearvip
✅ Benefits : Lifetime Trading Fee Discount -50%
คำจำกัดสิทธิ์ความรับผิดชอบ
ข้อมูลและบทความไม่ได้มีวัตถุประสงค์เพื่อก่อให้เกิดกิจกรรมทางการเงิน, การลงทุน, การซื้อขาย, ข้อเสนอแนะ หรือคำแนะนำประเภทอื่น ๆ ที่ให้หรือรับรองโดย TradingView อ่านเพิ่มเติมใน ข้อกำหนดการใช้งาน