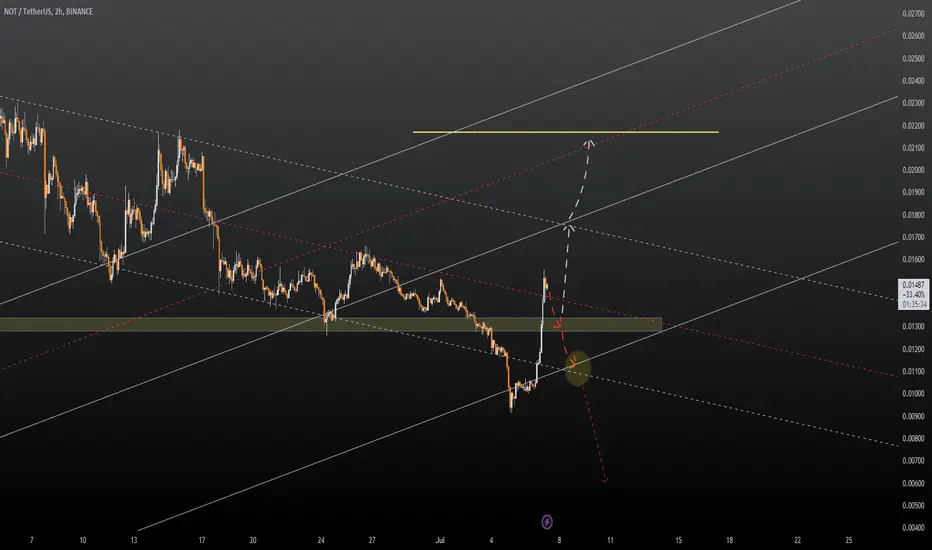
Hey Traders!, I foresee two potential scenarios for the movement of the NOT/USDT price:

 NOTUSDT
1. The price chart declines to the $0.01300 range, finds support, and then resumes its upward trajectory to reach $0.02100.
2. The price chart falls to the $0.01300 support area, breaks below the ascending channel, and continues to drop to $0.00750.
In my assessment, the first scenario is more likely, with an estimated 60% probability of the price rising to $0.02100.
NOTUSDT 1. The price chart declines to the $0.01300 range, finds support, and then resumes its upward trajectory to reach $0.02100.
2. The price chart falls to the $0.01300 support area, breaks below the ascending channel, and continues to drop to $0.00750.
In my assessment, the first scenario is more likely, with an estimated 60% probability of the price rising to $0.02100.

การนำเสนอที่เกี่ยวข้อง
คำจำกัดสิทธิ์ความรับผิดชอบ
ข้อมูลและบทความไม่ได้มีวัตถุประสงค์เพื่อก่อให้เกิดกิจกรรมทางการเงิน, การลงทุน, การซื้อขาย, ข้อเสนอแนะ หรือคำแนะนำประเภทอื่น ๆ ที่ให้หรือรับรองโดย TradingView อ่านเพิ่มเติมใน ข้อกำหนดการใช้งาน
การนำเสนอที่เกี่ยวข้อง
คำจำกัดสิทธิ์ความรับผิดชอบ
ข้อมูลและบทความไม่ได้มีวัตถุประสงค์เพื่อก่อให้เกิดกิจกรรมทางการเงิน, การลงทุน, การซื้อขาย, ข้อเสนอแนะ หรือคำแนะนำประเภทอื่น ๆ ที่ให้หรือรับรองโดย TradingView อ่านเพิ่มเติมใน ข้อกำหนดการใช้งาน