
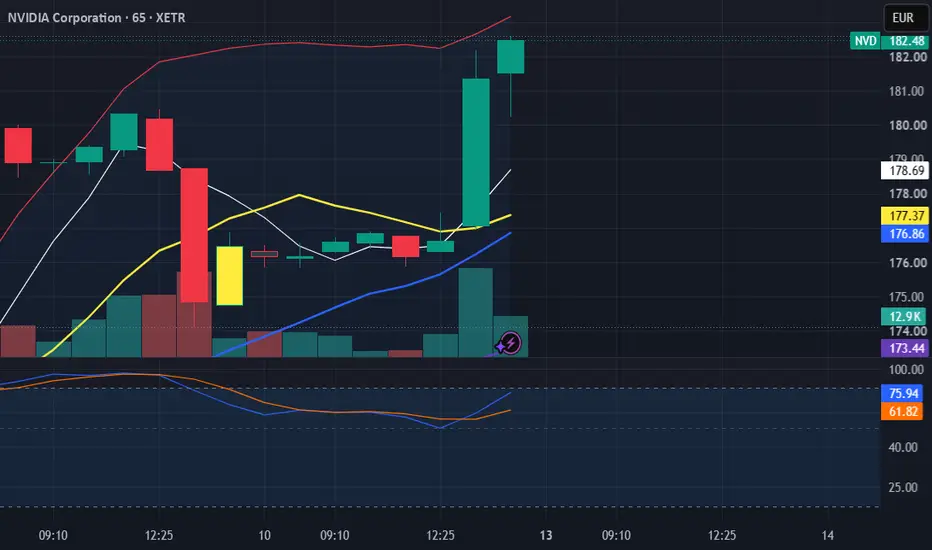
Bias: BULLISH — daily, weekly, and monthly all flash bull. Invalidation: a close below the 204–205 support shelf.
Pivot-Ladder:
Daily (Mon, Jul 13):
DR3 — 223.08
DR2 — 217.04
DR1 — 214.00 ← first target
CDL — 207.96 ← daily bias line
DS1 — 204.92 ← support shelf
DS2 — 198.88
DS3 — 195.84
Weekly (Jul 13–17):
WR3 — 237.45
WR2 — 224.23
WR1 — 217.59 ← confluence with DR1, ~3.5 apart
CWL — 204.37 ← weekly bias line, stacked on DS1
WS1 — 197.73
WS2 — 184.51
WS3 — 177.87
Monthly (July 2026):
MR3 — 267.46
MR2 — 249.87
MR1 — 224.98
CML — 207.39 ← confluence: sits within half a point of CDL
MS1 — 182.50
MS2 — 164.91
MS3 — 140.02
The setup: CDL (207.96) and CML (207.39) sit within about half a point of each other — the daily and monthly bias lines are effectively the same price. That's rare, and in my tracking, it produces a cleaner signal than either timeframe alone, because a breakthrough this level isn't just a daily event, it's a monthly one too.
Directly below that cluster is a second one: the weekly pivot (204.37) and daily S1 (204.92) sit within about half a point of each other, forming a shelf roughly three points under the pivot cluster. NVDA effectively has two lines stacked close together here, not one.
1._Structure: Above 208, the path of least resistance is up, daily — DR1 at 214.00 first, then weekly- WR1 at 217.59, which cluster within 3.5 points of each other and trade as one zone.
2._A dip between 208 and the 204–205 shelf isn't bearish yet — it's a hold-and-defend zone, buyable as long as the shelf holds on a closing basis.
**_The real invalidation is below 204, not below 208: that's where the daily and weekly floor break together.
Plain English: NVDA's daily and monthly levels are lined up on top of each other, which almost never happens — today's level and this month's level agree. As long as price holds above 208, dips are for buying, targeting 214 then 217.5. A close below 204 breaks the daily and weekly floor at the same time, and that's when the bullish case is off the table.
Nothing here is a black box. The levels are standard pivot math on the prior confirmed session, week, and month.
Not financial advice. Trade your own plan.
Pivot-Ladder:
Daily (Mon, Jul 13):
DR3 — 223.08
DR2 — 217.04
DR1 — 214.00 ← first target
CDL — 207.96 ← daily bias line
DS1 — 204.92 ← support shelf
DS2 — 198.88
DS3 — 195.84
Weekly (Jul 13–17):
WR3 — 237.45
WR2 — 224.23
WR1 — 217.59 ← confluence with DR1, ~3.5 apart
CWL — 204.37 ← weekly bias line, stacked on DS1
WS1 — 197.73
WS2 — 184.51
WS3 — 177.87
Monthly (July 2026):
MR3 — 267.46
MR2 — 249.87
MR1 — 224.98
CML — 207.39 ← confluence: sits within half a point of CDL
MS1 — 182.50
MS2 — 164.91
MS3 — 140.02
The setup: CDL (207.96) and CML (207.39) sit within about half a point of each other — the daily and monthly bias lines are effectively the same price. That's rare, and in my tracking, it produces a cleaner signal than either timeframe alone, because a breakthrough this level isn't just a daily event, it's a monthly one too.
Directly below that cluster is a second one: the weekly pivot (204.37) and daily S1 (204.92) sit within about half a point of each other, forming a shelf roughly three points under the pivot cluster. NVDA effectively has two lines stacked close together here, not one.
1._Structure: Above 208, the path of least resistance is up, daily — DR1 at 214.00 first, then weekly- WR1 at 217.59, which cluster within 3.5 points of each other and trade as one zone.
2._A dip between 208 and the 204–205 shelf isn't bearish yet — it's a hold-and-defend zone, buyable as long as the shelf holds on a closing basis.
**_The real invalidation is below 204, not below 208: that's where the daily and weekly floor break together.
Plain English: NVDA's daily and monthly levels are lined up on top of each other, which almost never happens — today's level and this month's level agree. As long as price holds above 208, dips are for buying, targeting 214 then 217.5. A close below 204 breaks the daily and weekly floor at the same time, and that's when the bullish case is off the table.
Nothing here is a black box. The levels are standard pivot math on the prior confirmed session, week, and month.
Not financial advice. Trade your own plan.
การซื้อขายยังคงดำเนินอยู่
#NVDA
คำจำกัดสิทธิ์ความรับผิดชอบ
ข้อมูลและบทความไม่ได้มีวัตถุประสงค์เพื่อก่อให้เกิดกิจกรรมทางการเงิน, การลงทุน, การซื้อขาย, ข้อเสนอแนะ หรือคำแนะนำประเภทอื่น ๆ ที่ให้หรือรับรองโดย TradingView อ่านเพิ่มเติมใน ข้อกำหนดการใช้งาน
คำจำกัดสิทธิ์ความรับผิดชอบ
ข้อมูลและบทความไม่ได้มีวัตถุประสงค์เพื่อก่อให้เกิดกิจกรรมทางการเงิน, การลงทุน, การซื้อขาย, ข้อเสนอแนะ หรือคำแนะนำประเภทอื่น ๆ ที่ให้หรือรับรองโดย TradingView อ่านเพิ่มเติมใน ข้อกำหนดการใช้งาน