Overview:
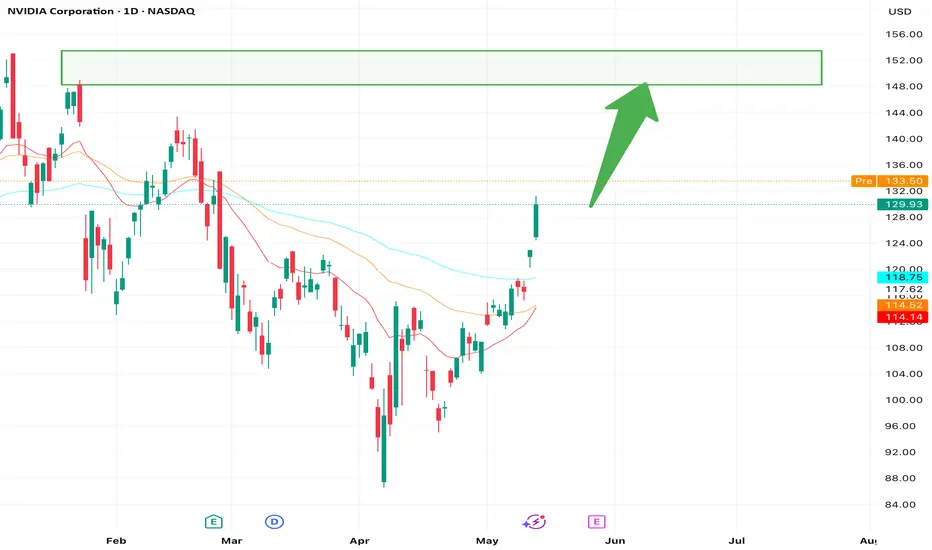
 NVDA is showing strong bullish momentum on the 2-hour chart, trading at $132.34 as of the latest candlestick. After a recovery from the March low of $88, the price is now testing a key resistance at $132.47. A breakout above this level could signal a continuation toward higher targets, supported by positive market sentiment and technical indicators.
Key Levels to Watch:
Resistance: $135.47
Next Target: $139.50 (psychological level and prior resistance)
Support: $116.24 (recent low, key support)
Trade Setup:
Direction: Buy on breakout
Entry: $133.50 (confirmation above resistance)
Profit Target: $139.50
Stop Loss: $125.00 (below recent pullback and 50-period MA)
Risk-Reward Ratio: 2:1 (Risk: $2.50, Reward: $5.00)
Follow for the Best Free AI Signals on the market
Ash.
การซื้อขายยังคงดำเนินอยู่
Going to TPบันทึก
Now or never, earnings on the edge
คำจำกัดสิทธิ์ความรับผิดชอบ
ข้อมูลและบทความไม่ได้มีวัตถุประสงค์เพื่อก่อให้เกิดกิจกรรมทางการเงิน, การลงทุน, การซื้อขาย, ข้อเสนอแนะ หรือคำแนะนำประเภทอื่น ๆ ที่ให้หรือรับรองโดย TradingView อ่านเพิ่มเติมใน ข้อกำหนดการใช้งาน
คำจำกัดสิทธิ์ความรับผิดชอบ
ข้อมูลและบทความไม่ได้มีวัตถุประสงค์เพื่อก่อให้เกิดกิจกรรมทางการเงิน, การลงทุน, การซื้อขาย, ข้อเสนอแนะ หรือคำแนะนำประเภทอื่น ๆ ที่ให้หรือรับรองโดย TradingView อ่านเพิ่มเติมใน ข้อกำหนดการใช้งาน