
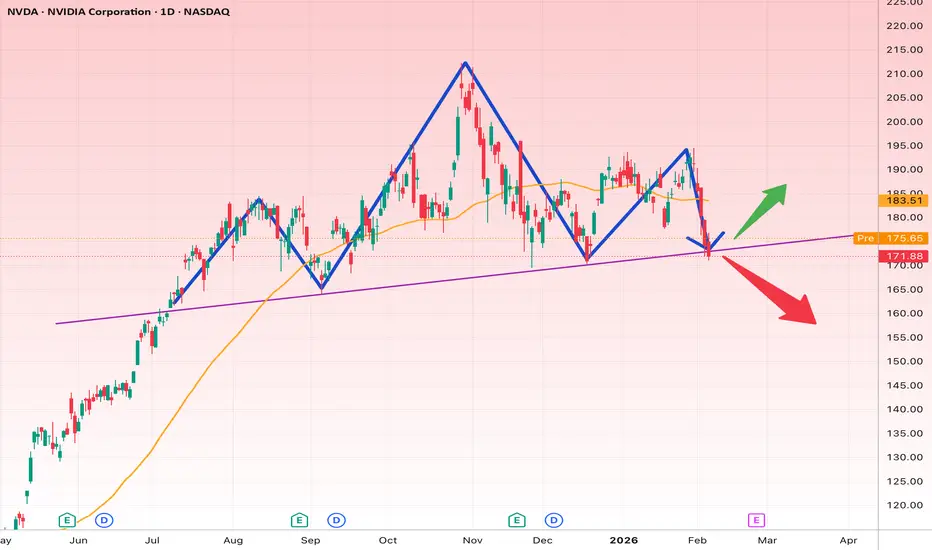
Price is sitting right on a rising trendline support around 172–175, which is a key decision zone.
Bullish scenario:
If this support holds, a rebound toward 183–190 is likely, aligning with prior swing highs and the moving average.
Bearish scenario:
A daily close below ~170 would signal a breakdown, opening downside toward 160–155.
Bias: Neutral → bullish only if trendline support holds.
Invalidation / Stop-loss: Below 170 (daily close).
This is a classic make-or-break level — wait for confirmation before committing.
Bullish scenario:
If this support holds, a rebound toward 183–190 is likely, aligning with prior swing highs and the moving average.
Bearish scenario:
A daily close below ~170 would signal a breakdown, opening downside toward 160–155.
Bias: Neutral → bullish only if trendline support holds.
Invalidation / Stop-loss: Below 170 (daily close).
This is a classic make-or-break level — wait for confirmation before committing.

คำจำกัดสิทธิ์ความรับผิดชอบ
ข้อมูลและบทความไม่ได้มีวัตถุประสงค์เพื่อก่อให้เกิดกิจกรรมทางการเงิน, การลงทุน, การซื้อขาย, ข้อเสนอแนะ หรือคำแนะนำประเภทอื่น ๆ ที่ให้หรือรับรองโดย TradingView อ่านเพิ่มเติมใน ข้อกำหนดการใช้งาน
คำจำกัดสิทธิ์ความรับผิดชอบ
ข้อมูลและบทความไม่ได้มีวัตถุประสงค์เพื่อก่อให้เกิดกิจกรรมทางการเงิน, การลงทุน, การซื้อขาย, ข้อเสนอแนะ หรือคำแนะนำประเภทอื่น ๆ ที่ให้หรือรับรองโดย TradingView อ่านเพิ่มเติมใน ข้อกำหนดการใช้งาน