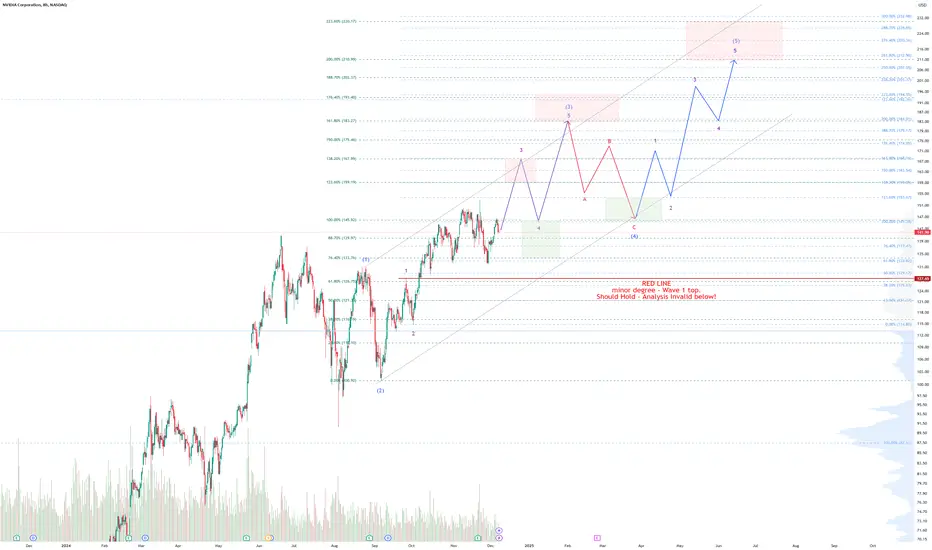
In this short piece, I present some visuals of my ideas on  NVDA targets.
If the chart patterns play well then my intention is to exit at around $183 to $193 and then catch the wave (4) low ideally at $146, for the final push up in this sequence in to $210 or slightly higher for a final exit.
Viewed from the perspective of a weekly or monthly chart -NVDA doesn't look complete at those higher levels, however, I suspect that the end in to the wave (5) around $210 will complete a multitude of larger wave degrees, thus start a much larger degree (wave 4) correction from that point.
**NVDA may be a strong barometer for the market peak on an intermediate scale. I will certainly consider this strongly.
NVDA targets. If the chart patterns play well then my intention is to exit at around $183 to $193 and then catch the wave (4) low ideally at $146, for the final push up in this sequence in to $210 or slightly higher for a final exit.
Viewed from the perspective of a weekly or monthly chart -
NVDA doesn't look complete at those higher levels, however, I suspect that the end in to the wave (5) around $210 will complete a multitude of larger wave degrees, thus start a much larger degree (wave 4) correction from that point.**NVDA may be a strong barometer for the market peak on an intermediate scale. I will certainly consider this strongly.

Student of the market since 2011. Technical analyst using some fundamentals, Elliott Wave Analysis, Volume Profiling, Supply & Demand and 'Flow' - my own indicator.
การนำเสนอที่เกี่ยวข้อง
คำจำกัดสิทธิ์ความรับผิดชอบ
ข้อมูลและบทความไม่ได้มีวัตถุประสงค์เพื่อก่อให้เกิดกิจกรรมทางการเงิน, การลงทุน, การซื้อขาย, ข้อเสนอแนะ หรือคำแนะนำประเภทอื่น ๆ ที่ให้หรือรับรองโดย TradingView อ่านเพิ่มเติมใน ข้อกำหนดการใช้งาน
Student of the market since 2011. Technical analyst using some fundamentals, Elliott Wave Analysis, Volume Profiling, Supply & Demand and 'Flow' - my own indicator.
การนำเสนอที่เกี่ยวข้อง
คำจำกัดสิทธิ์ความรับผิดชอบ
ข้อมูลและบทความไม่ได้มีวัตถุประสงค์เพื่อก่อให้เกิดกิจกรรมทางการเงิน, การลงทุน, การซื้อขาย, ข้อเสนอแนะ หรือคำแนะนำประเภทอื่น ๆ ที่ให้หรือรับรองโดย TradingView อ่านเพิ่มเติมใน ข้อกำหนดการใช้งาน