
Market Structure
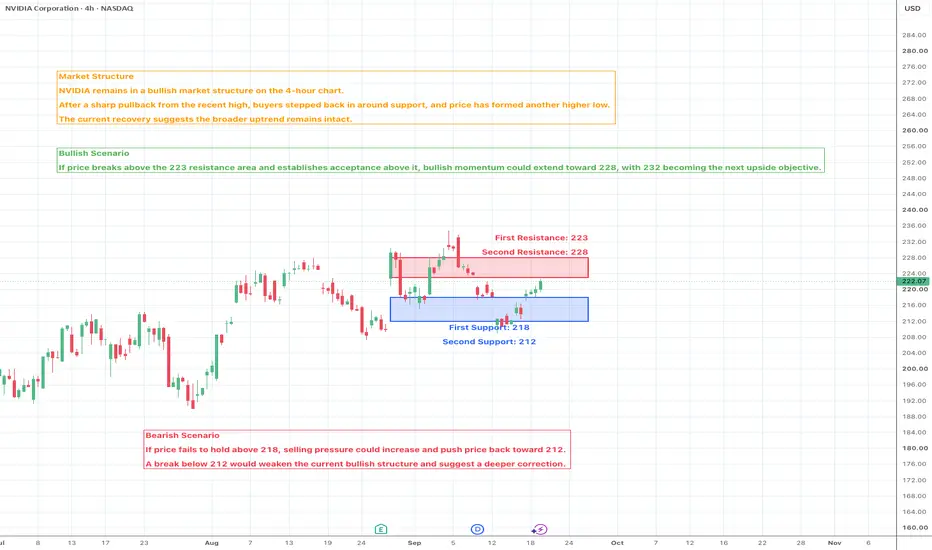
NVIDIA remains in a bullish market structure on the 4-hour chart. After a sharp pullback from the recent high, buyers stepped back in around support, and price has formed another higher low. The current recovery suggests the broader uptrend remains intact.
Market Sentiment - Moderately Bullish
Buying momentum has improved following the recent correction. Although sellers remain active near resistance, the overall structure still favors the bulls as long as higher lows continue to hold.
Bullish Scenario
If price breaks above the 223 resistance area and establishes acceptance above it, bullish momentum could extend toward 228, with 232 becoming the next upside objective.
Bearish Scenario
If price fails to hold above 218, selling pressure could increase and push price back toward 212. A break below 212 would weaken the current bullish structure and suggest a deeper correction.
────────────────────
Market View
NVIDIA has recovered well after its recent pullback and is once again approaching an important resistance zone. The current price action reflects improving buyer confidence, but a confirmed breakout is still needed before expecting another leg higher.
────────────────────
Key Levels
First Resistance: 223
Second Resistance: 228
First Support: 218
Second Support: 212
────────────────────
Outlook
A sustained move above 223 would reinforce the bullish outlook and could open the door toward 228–232.
However, if price loses 218, a deeper pullback toward 212 may develop before buyers attempt another recovery.
────────────────────
Event Risk
NVIDIA may remain sensitive to broader Nasdaq performance, U.S. economic data, Treasury yields, AI-related developments, semiconductor sector news, and company-specific announcements. These factors could increase short-term volatility.
────────────────────
Please share your view below:
Do you think NVIDIA is ready to break above 223 and resume its uptrend, or will sellers trigger another pullback from resistance?
I'll continue sharing more Market Structure and Key Level updates.
NVIDIA remains in a bullish market structure on the 4-hour chart. After a sharp pullback from the recent high, buyers stepped back in around support, and price has formed another higher low. The current recovery suggests the broader uptrend remains intact.
Market Sentiment - Moderately Bullish
Buying momentum has improved following the recent correction. Although sellers remain active near resistance, the overall structure still favors the bulls as long as higher lows continue to hold.
Bullish Scenario
If price breaks above the 223 resistance area and establishes acceptance above it, bullish momentum could extend toward 228, with 232 becoming the next upside objective.
Bearish Scenario
If price fails to hold above 218, selling pressure could increase and push price back toward 212. A break below 212 would weaken the current bullish structure and suggest a deeper correction.
────────────────────
Market View
NVIDIA has recovered well after its recent pullback and is once again approaching an important resistance zone. The current price action reflects improving buyer confidence, but a confirmed breakout is still needed before expecting another leg higher.
────────────────────
Key Levels
First Resistance: 223
Second Resistance: 228
First Support: 218
Second Support: 212
────────────────────
Outlook
A sustained move above 223 would reinforce the bullish outlook and could open the door toward 228–232.
However, if price loses 218, a deeper pullback toward 212 may develop before buyers attempt another recovery.
────────────────────
Event Risk
NVIDIA may remain sensitive to broader Nasdaq performance, U.S. economic data, Treasury yields, AI-related developments, semiconductor sector news, and company-specific announcements. These factors could increase short-term volatility.
────────────────────
Please share your view below:
Do you think NVIDIA is ready to break above 223 and resume its uptrend, or will sellers trigger another pullback from resistance?
I'll continue sharing more Market Structure and Key Level updates.

การนำเสนอที่เกี่ยวข้อง
คำจำกัดสิทธิ์ความรับผิดชอบ
ข้อมูลและบทความไม่ได้มีวัตถุประสงค์เพื่อก่อให้เกิดกิจกรรมทางการเงิน, การลงทุน, การซื้อขาย, ข้อเสนอแนะ หรือคำแนะนำประเภทอื่น ๆ ที่ให้หรือรับรองโดย TradingView อ่านเพิ่มเติมใน ข้อกำหนดการใช้งาน
การนำเสนอที่เกี่ยวข้อง
คำจำกัดสิทธิ์ความรับผิดชอบ
ข้อมูลและบทความไม่ได้มีวัตถุประสงค์เพื่อก่อให้เกิดกิจกรรมทางการเงิน, การลงทุน, การซื้อขาย, ข้อเสนอแนะ หรือคำแนะนำประเภทอื่น ๆ ที่ให้หรือรับรองโดย TradingView อ่านเพิ่มเติมใน ข้อกำหนดการใช้งาน