Long
$NWHM Forming 3 Month #AscendingTriangle #ChartPattern
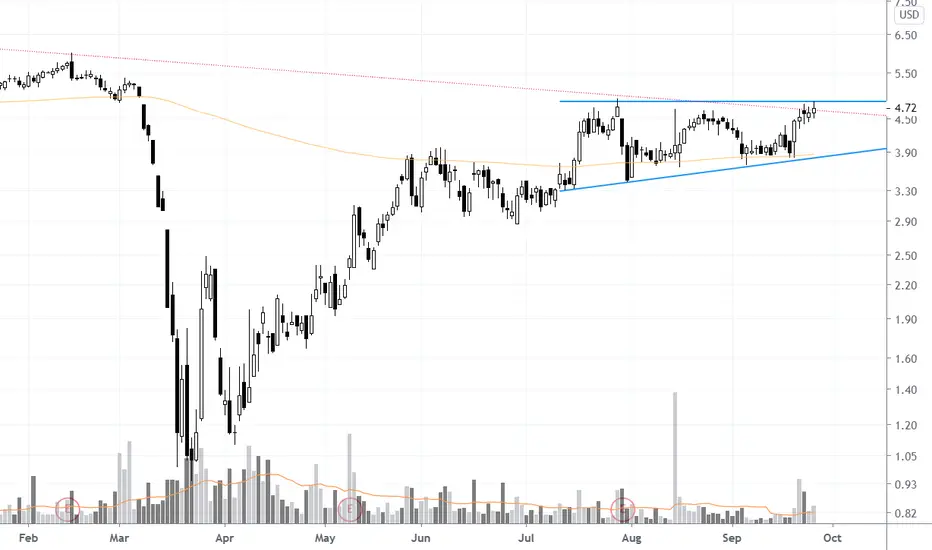
With the market selling off the last 3 weeks, $NYSE:NWHM been showing relative strength trading sideways to up. The stock has formed an ascending triangle chart pattern with upper boundary around $4.85 acting as resistance. The stock spent the last 4 sessions trading just under that level. The stock is also breaking a long weekly down trendline (red line on the chart), adding to the importance a possible chart pattern breakout.
Volume pattern also showing buying interest and the stock could be ready to breakout early this week. Buy a daily close about chart patter upper boundary for a possible leg higher.
Volume pattern also showing buying interest and the stock could be ready to breakout early this week. Buy a daily close about chart patter upper boundary for a possible leg higher.
บันทึก
broke out on good volume today and i posted a breakout mode post. please follow that one for updates. i won't be updating this post anymore.
✔ Momentum & Breakout Trader Since 2006 | Influenced by Mark Minervini VCP Trading Style & William O'Neil CANSLIM 📈
✔ Follow me on Twitter @taplot - twitter.com/TaPlot
✔ YouTube channel youtube.com/@taplot
✔ Follow me on Twitter @taplot - twitter.com/TaPlot
✔ YouTube channel youtube.com/@taplot
คำจำกัดสิทธิ์ความรับผิดชอบ
ข้อมูลและบทความไม่ได้มีวัตถุประสงค์เพื่อก่อให้เกิดกิจกรรมทางการเงิน, การลงทุน, การซื้อขาย, ข้อเสนอแนะ หรือคำแนะนำประเภทอื่น ๆ ที่ให้หรือรับรองโดย TradingView อ่านเพิ่มเติมใน ข้อกำหนดการใช้งาน
✔ Momentum & Breakout Trader Since 2006 | Influenced by Mark Minervini VCP Trading Style & William O'Neil CANSLIM 📈
✔ Follow me on Twitter @taplot - twitter.com/TaPlot
✔ YouTube channel youtube.com/@taplot
✔ Follow me on Twitter @taplot - twitter.com/TaPlot
✔ YouTube channel youtube.com/@taplot
คำจำกัดสิทธิ์ความรับผิดชอบ
ข้อมูลและบทความไม่ได้มีวัตถุประสงค์เพื่อก่อให้เกิดกิจกรรมทางการเงิน, การลงทุน, การซื้อขาย, ข้อเสนอแนะ หรือคำแนะนำประเภทอื่น ๆ ที่ให้หรือรับรองโดย TradingView อ่านเพิ่มเติมใน ข้อกำหนดการใช้งาน