

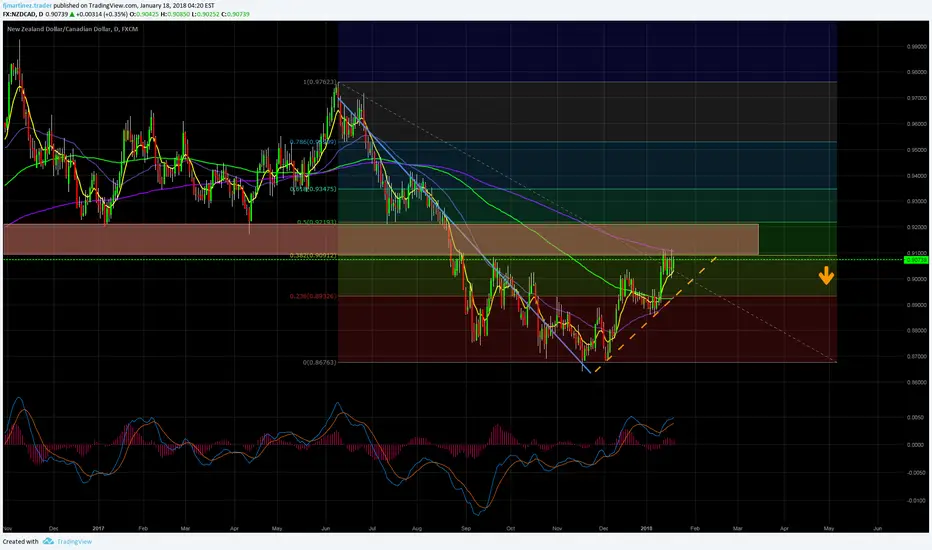
With the NZDCAD we have the reverse situation as I writed in the EURAUD analysis , it is in an downward rally, is inside correction and is finding an historic support area coinciding with fibonacci level of 38% and is touching the 300 WMA. It could be a signal showing the end of the correction.
I draw a trend line (Orange line) and if it is crossed downward and the 150 WMA (Green) is crossed too, I'll open a sell order with:
- Partial close 0.8710
- Stop loss 0.9260.
- Last partial close, moving the stop loss.
Remember:
You Never should convert a Winning position into a lossing position
I draw a trend line (Orange line) and if it is crossed downward and the 150 WMA (Green) is crossed too, I'll open a sell order with:
- Partial close 0.8710
- Stop loss 0.9260.
- Last partial close, moving the stop loss.
Remember:
You Never should convert a Winning position into a lossing position

คำจำกัดสิทธิ์ความรับผิดชอบ
ข้อมูลและบทความไม่ได้มีวัตถุประสงค์เพื่อก่อให้เกิดกิจกรรมทางการเงิน, การลงทุน, การซื้อขาย, ข้อเสนอแนะ หรือคำแนะนำประเภทอื่น ๆ ที่ให้หรือรับรองโดย TradingView อ่านเพิ่มเติมใน ข้อกำหนดการใช้งาน
คำจำกัดสิทธิ์ความรับผิดชอบ
ข้อมูลและบทความไม่ได้มีวัตถุประสงค์เพื่อก่อให้เกิดกิจกรรมทางการเงิน, การลงทุน, การซื้อขาย, ข้อเสนอแนะ หรือคำแนะนำประเภทอื่น ๆ ที่ให้หรือรับรองโดย TradingView อ่านเพิ่มเติมใน ข้อกำหนดการใช้งาน