

📣 Attention Traders! 📈🔍
🔹 NZDCAD, Short, Swing Trade 🔹
📊 Here are the key points for a potential trading opportunity in NZDCAD:
1️⃣ The Daily Chart indicates a downtrend as the EMA 108 is below the SMA 169.
2️⃣ Our AI screener indicates that CAD strength has transitioned from the weak side to the strong side since October 19, 2023.
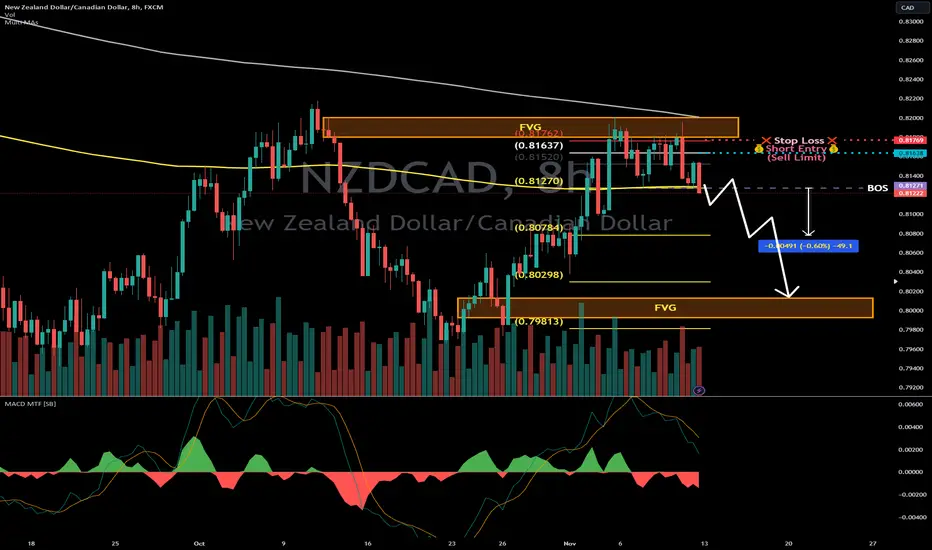
3️⃣ On the NZDCAD 8-hour chart, a Lower High has formed between the EMA 108 and SMA 169, filling the FVG (Fair Value Gap) that formed on October 23, 2023.
4️⃣ Last Friday, November 10, 2023, a BOS (Break of Structure) occurred after the AUDCAD also experienced a BOS.
5️⃣ This setup suggests a Short Swing trade strategy, targeting levels below: 0.8127, 0.8078, 0.80298, and 0.7981. There is still a possibility of reaching the FVG at 0.8012, given the overall downtrend on the Daily Chart.
6️⃣ Set a Stop Loss at 0.8176 to manage risk effectively.
7️⃣ The short entry zone is between 0.8130 and 0.8164.
8️⃣ Consider entering the short trade on an Hourly Chart retracement above 0.8078.
9️⃣ Aim for a minimum profit target of capturing 40 pips.
Keep a close eye on these levels and trends in NZDCAD for potential trading opportunities. Remember to manage your risk and trade responsibly!
✅ Stay tuned for more updates and analysis. Happy trading! 🚀💰
🔹 NZDCAD, Short, Swing Trade 🔹
📊 Here are the key points for a potential trading opportunity in NZDCAD:
1️⃣ The Daily Chart indicates a downtrend as the EMA 108 is below the SMA 169.
2️⃣ Our AI screener indicates that CAD strength has transitioned from the weak side to the strong side since October 19, 2023.
3️⃣ On the NZDCAD 8-hour chart, a Lower High has formed between the EMA 108 and SMA 169, filling the FVG (Fair Value Gap) that formed on October 23, 2023.
4️⃣ Last Friday, November 10, 2023, a BOS (Break of Structure) occurred after the AUDCAD also experienced a BOS.
5️⃣ This setup suggests a Short Swing trade strategy, targeting levels below: 0.8127, 0.8078, 0.80298, and 0.7981. There is still a possibility of reaching the FVG at 0.8012, given the overall downtrend on the Daily Chart.
6️⃣ Set a Stop Loss at 0.8176 to manage risk effectively.
7️⃣ The short entry zone is between 0.8130 and 0.8164.
8️⃣ Consider entering the short trade on an Hourly Chart retracement above 0.8078.
9️⃣ Aim for a minimum profit target of capturing 40 pips.
Keep a close eye on these levels and trends in NZDCAD for potential trading opportunities. Remember to manage your risk and trade responsibly!
✅ Stay tuned for more updates and analysis. Happy trading! 🚀💰

🔥my free signals and AI trading indicators channel telegram
t.me/strengthboosters
~1 Forex setup per day. With ICT setup for intraday trading —— Accuracy +80%
-Booster highlight:
US stocks and Crypto watch list update each weekend.
t.me/strengthboosters
~1 Forex setup per day. With ICT setup for intraday trading —— Accuracy +80%
-Booster highlight:
US stocks and Crypto watch list update each weekend.
คำจำกัดสิทธิ์ความรับผิดชอบ
ข้อมูลและบทความไม่ได้มีวัตถุประสงค์เพื่อก่อให้เกิดกิจกรรมทางการเงิน, การลงทุน, การซื้อขาย, ข้อเสนอแนะ หรือคำแนะนำประเภทอื่น ๆ ที่ให้หรือรับรองโดย TradingView อ่านเพิ่มเติมใน ข้อกำหนดการใช้งาน
🔥my free signals and AI trading indicators channel telegram
t.me/strengthboosters
~1 Forex setup per day. With ICT setup for intraday trading —— Accuracy +80%
-Booster highlight:
US stocks and Crypto watch list update each weekend.
t.me/strengthboosters
~1 Forex setup per day. With ICT setup for intraday trading —— Accuracy +80%
-Booster highlight:
US stocks and Crypto watch list update each weekend.
คำจำกัดสิทธิ์ความรับผิดชอบ
ข้อมูลและบทความไม่ได้มีวัตถุประสงค์เพื่อก่อให้เกิดกิจกรรมทางการเงิน, การลงทุน, การซื้อขาย, ข้อเสนอแนะ หรือคำแนะนำประเภทอื่น ๆ ที่ให้หรือรับรองโดย TradingView อ่านเพิ่มเติมใน ข้อกำหนดการใช้งาน