

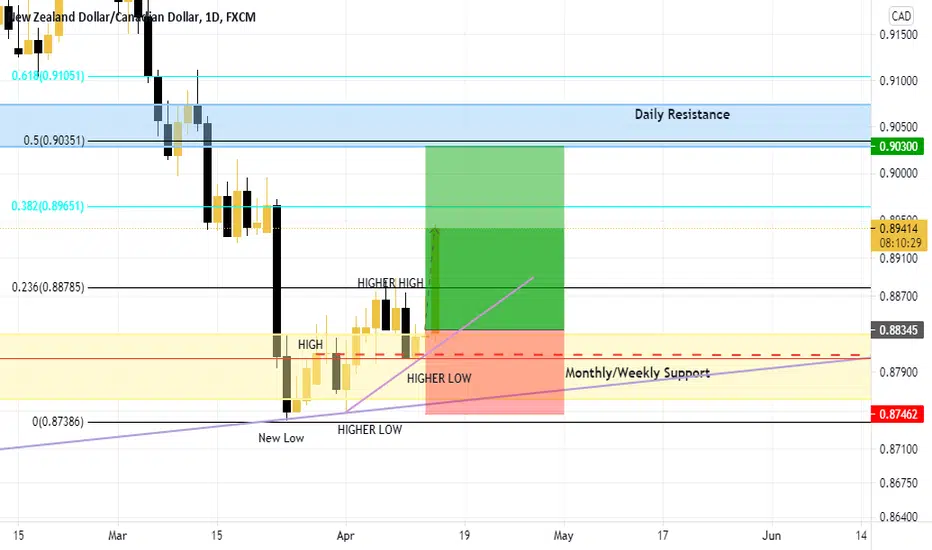
Price pulled back and tested the break of structure, which correlated with the neckline of the double bottom, and the 61.98 fib level (if you drew a fib from the new low to the new high on the 4hr timeframe.)
I am expecting price to to ultimately test the previous higher low, which also correlates with the daily resistance and the 61.8 fib level.
Take a look at the original analysis

I am expecting price to to ultimately test the previous higher low, which also correlates with the daily resistance and the 61.8 fib level.
Take a look at the original analysis

การนำเสนอที่เกี่ยวข้อง
คำจำกัดสิทธิ์ความรับผิดชอบ
ข้อมูลและบทความไม่ได้มีวัตถุประสงค์เพื่อก่อให้เกิดกิจกรรมทางการเงิน, การลงทุน, การซื้อขาย, ข้อเสนอแนะ หรือคำแนะนำประเภทอื่น ๆ ที่ให้หรือรับรองโดย TradingView อ่านเพิ่มเติมใน ข้อกำหนดการใช้งาน
การนำเสนอที่เกี่ยวข้อง
คำจำกัดสิทธิ์ความรับผิดชอบ
ข้อมูลและบทความไม่ได้มีวัตถุประสงค์เพื่อก่อให้เกิดกิจกรรมทางการเงิน, การลงทุน, การซื้อขาย, ข้อเสนอแนะ หรือคำแนะนำประเภทอื่น ๆ ที่ให้หรือรับรองโดย TradingView อ่านเพิ่มเติมใน ข้อกำหนดการใช้งาน