

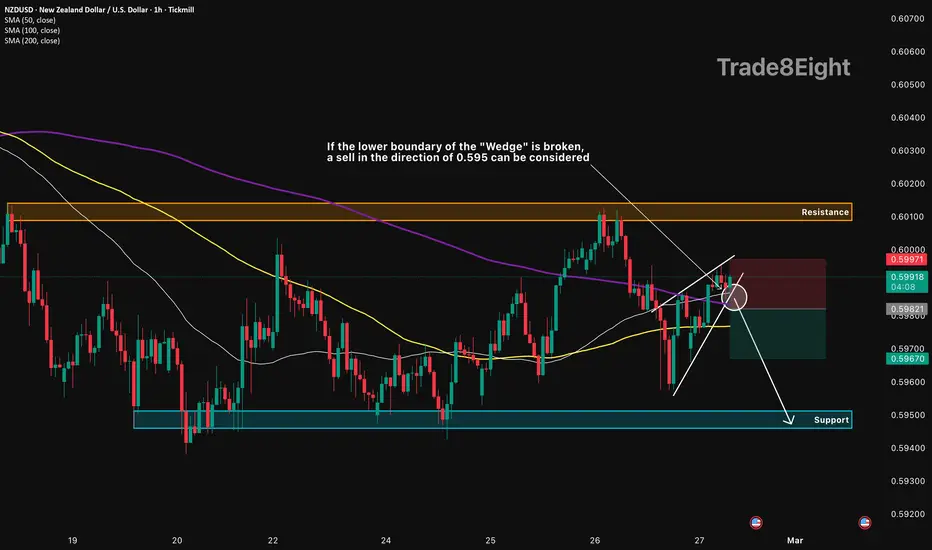
🛠 Technical Analysis: On the H1 chart, NZDUSD is compressing inside a short-term wedge, signaling fading momentum after the recent bounce. Price is repeatedly failing to reclaim the upper resistance band near 0.6010, keeping upside attempts capped. The SMA 50/100/200 are tightly clustered around current price, confirming indecision and increasing the probability of a sharp move once structure breaks. The key trigger is the lower wedge boundary—a clean break below it would confirm bearish continuation. The trade idea targets a push lower toward the next demand area, while the blue support band around ~0.5950 remains the larger downside magnet. As long as price stays under resistance and the wedge breaks down, sell pressure should dominate in the short term.
———————————————
❗️Trade Parameters (SELL)
———————————————
➡️ Entry Point: 0.59821
🎯 Take Profit: 0.59670
🔴 Stop Loss: 0.59971
⚠️ Disclaimer: This is a potential trade idea based on current analysis; market conditions and price direction are subject to change based on news factors and volatility.
———————————————
❗️Trade Parameters (SELL)
———————————————
➡️ Entry Point: 0.59821
🎯 Take Profit: 0.59670
🔴 Stop Loss: 0.59971
⚠️ Disclaimer: This is a potential trade idea based on current analysis; market conditions and price direction are subject to change based on news factors and volatility.
บันทึก
🌍 Fundamental Analysis: NZD remains constrained after the RBNZ held policy settings and signaled limited urgency to tighten, which continues to cap Kiwi upside near the 0.6000 area. Market focus stays on US macro signals and risk headlines (including energy/geopolitics), which can keep the USD bid and pressure NZDUSD on breakdown attempts. NZDUSD has been rotating around a defined short-term range with a bearish break risk if the pair slips below key supports.ปิดการเทรด ด้วยตนเอง

⚠️ Public market view only. Not financial advice. DYOR and manage your own risk.
การนำเสนอที่เกี่ยวข้อง
คำจำกัดสิทธิ์ความรับผิดชอบ
ข้อมูลและบทความไม่ได้มีวัตถุประสงค์เพื่อก่อให้เกิดกิจกรรมทางการเงิน, การลงทุน, การซื้อขาย, ข้อเสนอแนะ หรือคำแนะนำประเภทอื่น ๆ ที่ให้หรือรับรองโดย TradingView อ่านเพิ่มเติมใน ข้อกำหนดการใช้งาน
⚠️ Public market view only. Not financial advice. DYOR and manage your own risk.
การนำเสนอที่เกี่ยวข้อง
คำจำกัดสิทธิ์ความรับผิดชอบ
ข้อมูลและบทความไม่ได้มีวัตถุประสงค์เพื่อก่อให้เกิดกิจกรรมทางการเงิน, การลงทุน, การซื้อขาย, ข้อเสนอแนะ หรือคำแนะนำประเภทอื่น ๆ ที่ให้หรือรับรองโดย TradingView อ่านเพิ่มเติมใน ข้อกำหนดการใช้งาน