

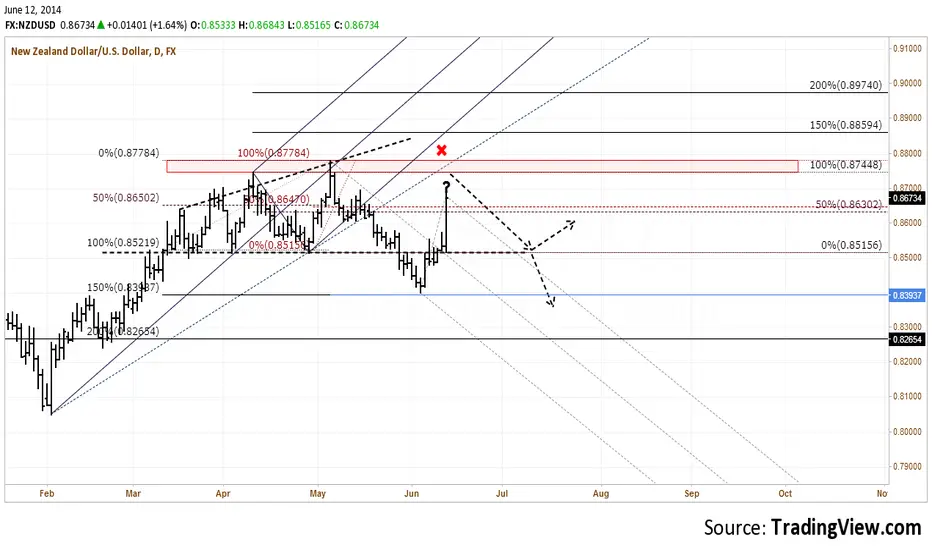
Current price action could be a fake move to the upside... Unless 0.8515 proves to be a tested support level.
Dashed light grey Median lines plots the potential down slope (but could be invalidated if price goes higher).
I expect the upside move to be capped not higher than 0.875 - 0.877. If price doesn't break this level, expect a test of support at 0.852, which if gives way could go all the way to 0.8265 to complete the broadening triangle's target.
Also look for the daily close. A pinbar kind of set up near 0.864 - 0.863 could give some clues.
Dashed light grey Median lines plots the potential down slope (but could be invalidated if price goes higher).
I expect the upside move to be capped not higher than 0.875 - 0.877. If price doesn't break this level, expect a test of support at 0.852, which if gives way could go all the way to 0.8265 to complete the broadening triangle's target.
Also look for the daily close. A pinbar kind of set up near 0.864 - 0.863 could give some clues.

การนำเสนอที่เกี่ยวข้อง
คำจำกัดสิทธิ์ความรับผิดชอบ
ข้อมูลและบทความไม่ได้มีวัตถุประสงค์เพื่อก่อให้เกิดกิจกรรมทางการเงิน, การลงทุน, การซื้อขาย, ข้อเสนอแนะ หรือคำแนะนำประเภทอื่น ๆ ที่ให้หรือรับรองโดย TradingView อ่านเพิ่มเติมใน ข้อกำหนดการใช้งาน
การนำเสนอที่เกี่ยวข้อง
คำจำกัดสิทธิ์ความรับผิดชอบ
ข้อมูลและบทความไม่ได้มีวัตถุประสงค์เพื่อก่อให้เกิดกิจกรรมทางการเงิน, การลงทุน, การซื้อขาย, ข้อเสนอแนะ หรือคำแนะนำประเภทอื่น ๆ ที่ให้หรือรับรองโดย TradingView อ่านเพิ่มเติมใน ข้อกำหนดการใช้งาน