

Good morning,
After seeing price development with NZDUSD I have decided to share my analysis.
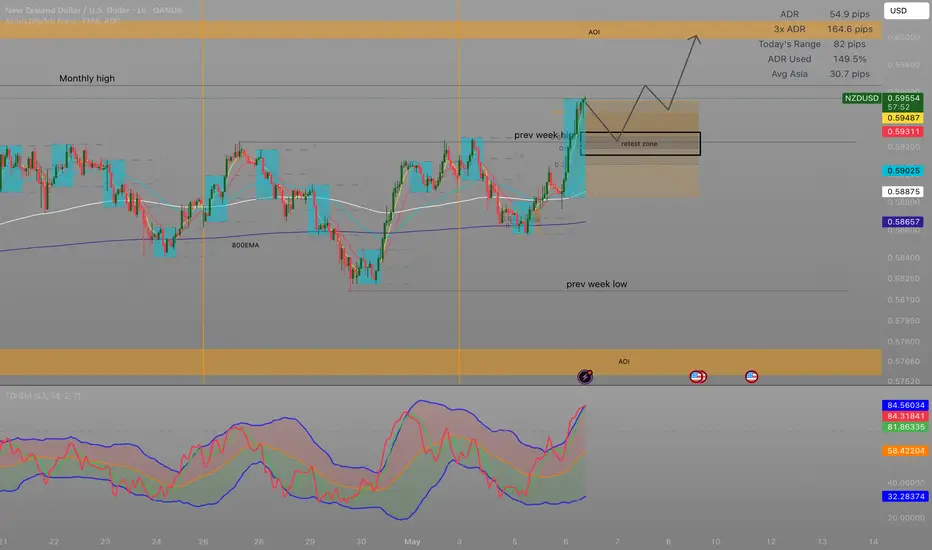
As you can see with the shift long that has occurred within the Asia session this morning (06/05/2026) price has now exceeded ADR which means we should be expecting a pullback. You can see on the chart ADR is 51.2 pips and this is calculated over the last 14 days, todays ADR is 78.1 pips. We can also observe that price is out the band to the upside on the TDI, if you put a fibonacci retracement on the high and low of the Asia session we can see that the 0.618 zone aligns with price zone flipping off of the previous weeks highs. Due to this I believe today we will observe a pullback before continuing short.
We have been in a range for the last 3 weeks, with previous weeks low inducing below the 800EMA for shorts.You can also see a high created during New York on Tuesday 14th April, that price has been reversing at has now been closed above. I believe we will now see a continuation of the uptrend we were in. The PFL, which was created when (in march) price shorted passed this years low created on the 9th January and swept that previous low before reversing longside.
Thank you for taking your time to read, please leave any opinions or questions in the comments.
Any advice is also welcome.
PFL- Peak formation low
ADR- Average daily range
TDI- Traders dynamic index
AOI- Area of interest
After seeing price development with NZDUSD I have decided to share my analysis.
As you can see with the shift long that has occurred within the Asia session this morning (06/05/2026) price has now exceeded ADR which means we should be expecting a pullback. You can see on the chart ADR is 51.2 pips and this is calculated over the last 14 days, todays ADR is 78.1 pips. We can also observe that price is out the band to the upside on the TDI, if you put a fibonacci retracement on the high and low of the Asia session we can see that the 0.618 zone aligns with price zone flipping off of the previous weeks highs. Due to this I believe today we will observe a pullback before continuing short.
We have been in a range for the last 3 weeks, with previous weeks low inducing below the 800EMA for shorts.You can also see a high created during New York on Tuesday 14th April, that price has been reversing at has now been closed above. I believe we will now see a continuation of the uptrend we were in. The PFL, which was created when (in march) price shorted passed this years low created on the 9th January and swept that previous low before reversing longside.
Thank you for taking your time to read, please leave any opinions or questions in the comments.
Any advice is also welcome.
PFL- Peak formation low
ADR- Average daily range
TDI- Traders dynamic index
AOI- Area of interest
การซื้อขายยังคงดำเนินอยู่
To update the post,I wasn't expecting the continuation extension long coming out of Asia and into London. Due to the technical indicators stated in the post I was expecting a London reversal to the zone shown in the image however there was an extension to the monthly high. We may still observe a pullback for the rest of the day, however I failed to confirm that I typically trade in line with with the EMA's and rarely trade against them, this is because I can have higher certainty when trading in line with price action trend rather than placing a position counter trend. I would still like for there to be a steeper pullback back into the original zone stated as price seems to have peaked on the monthly high shown in the post, this peak would have induced a long sentiment and the short back into the range will likely relinquish this sentiment before shifting long once again. To confirm; I am still waiting for a steeper the pullback in price before I enter long.
ออร์เดอร์ถูกยกเลิก
To update post, To update my post, I will confirm that after Thursday14th May NY session shorts as well as Friday 15th May Asia shorts render my thesis invalid. I didn't get the set up I was looking for therefore didn't execute any long positions. The double top seen May 6th and May 7th was the cause of uncertainty and rightfully so given current price action.
Thank you for reading.

คำจำกัดสิทธิ์ความรับผิดชอบ
ข้อมูลและบทความไม่ได้มีวัตถุประสงค์เพื่อก่อให้เกิดกิจกรรมทางการเงิน, การลงทุน, การซื้อขาย, ข้อเสนอแนะ หรือคำแนะนำประเภทอื่น ๆ ที่ให้หรือรับรองโดย TradingView อ่านเพิ่มเติมใน ข้อกำหนดการใช้งาน
คำจำกัดสิทธิ์ความรับผิดชอบ
ข้อมูลและบทความไม่ได้มีวัตถุประสงค์เพื่อก่อให้เกิดกิจกรรมทางการเงิน, การลงทุน, การซื้อขาย, ข้อเสนอแนะ หรือคำแนะนำประเภทอื่น ๆ ที่ให้หรือรับรองโดย TradingView อ่านเพิ่มเติมใน ข้อกำหนดการใช้งาน