

Hi Traders!
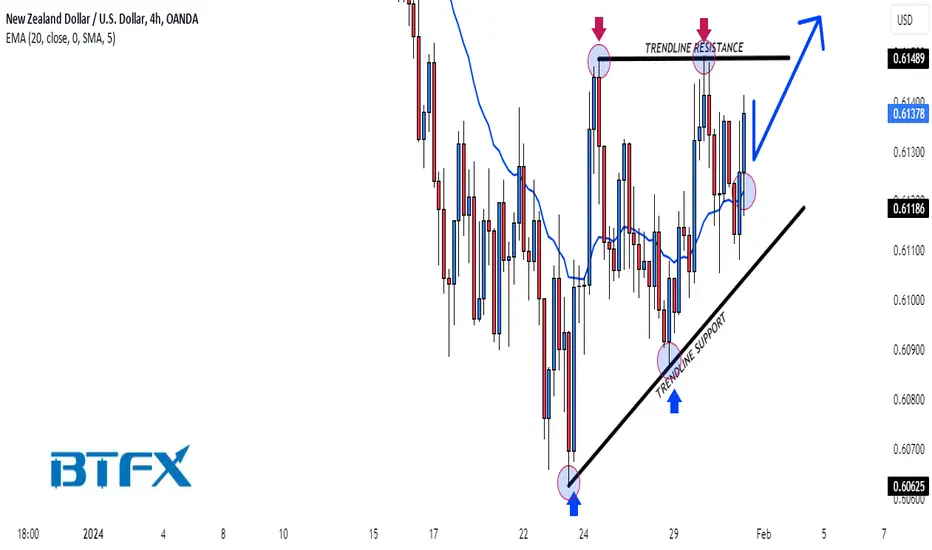
An ascending triangle is forming on the NZDUSD 4H chart, and we could have a breakout soon.
Here are the details:
The market has found support and resistance at both the trendline support and trendline resistance of the triangle, as the market is looking for a direction. Looking at the price action, it looks bullish due to the market swings; the lows and highs are starting to get higher, and additionally, the market has broken and closed above the 20 EMA.
As long as the market is still above the 20 EMA, our view will remain bullish. We expect some more consolidation before a possible third attempt at the trendline resistance.
Preferred Direction: Buy
Technical Indicators: 20 EMA
Resistance: 0.61489
Support: 0.61186
Please make sure to click on the like/boost button 🚀 as your support greatly helps.
Trade safely and responsibly.
BluetonaFX
An ascending triangle is forming on the NZDUSD 4H chart, and we could have a breakout soon.
Here are the details:
The market has found support and resistance at both the trendline support and trendline resistance of the triangle, as the market is looking for a direction. Looking at the price action, it looks bullish due to the market swings; the lows and highs are starting to get higher, and additionally, the market has broken and closed above the 20 EMA.
As long as the market is still above the 20 EMA, our view will remain bullish. We expect some more consolidation before a possible third attempt at the trendline resistance.
Preferred Direction: Buy
Technical Indicators: 20 EMA
Resistance: 0.61489
Support: 0.61186
Please make sure to click on the like/boost button 🚀 as your support greatly helps.
Trade safely and responsibly.
BluetonaFX
ปิดการเทรด: ถึงเป้าหมายการทำกำไร

JOIN OUR FREE TELEGRAM CHANNEL
t.me/bluetonaFX
t.me/bluetonaFX
คำจำกัดสิทธิ์ความรับผิดชอบ
ข้อมูลและบทความไม่ได้มีวัตถุประสงค์เพื่อก่อให้เกิดกิจกรรมทางการเงิน, การลงทุน, การซื้อขาย, ข้อเสนอแนะ หรือคำแนะนำประเภทอื่น ๆ ที่ให้หรือรับรองโดย TradingView อ่านเพิ่มเติมใน ข้อกำหนดการใช้งาน
JOIN OUR FREE TELEGRAM CHANNEL
t.me/bluetonaFX
t.me/bluetonaFX
คำจำกัดสิทธิ์ความรับผิดชอบ
ข้อมูลและบทความไม่ได้มีวัตถุประสงค์เพื่อก่อให้เกิดกิจกรรมทางการเงิน, การลงทุน, การซื้อขาย, ข้อเสนอแนะ หรือคำแนะนำประเภทอื่น ๆ ที่ให้หรือรับรองโดย TradingView อ่านเพิ่มเติมใน ข้อกำหนดการใช้งาน