
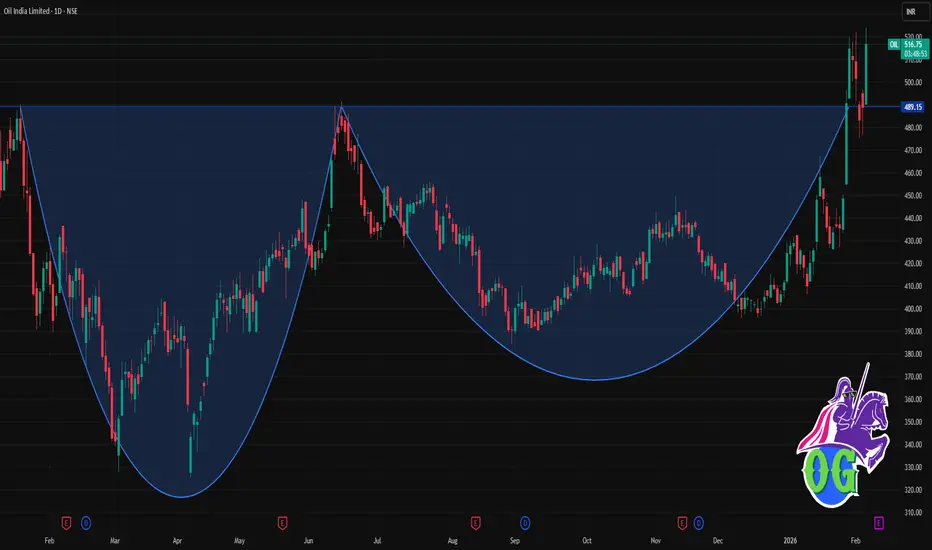
📊 Current Approx Price (as per today data): ₹488.90 – ₹514.4 range (varies by platform/time) — OIL has recently traded around this area near daily pivot/major levels.
📈 Daily Pivot & Key Levels (Classic method)
Level Price (₹) Role
R3 (3rd Resistance) 507.45 Strong upside hurdle
R2 499.40 Secondary resistance
R1 491.35 Near-term resistance
Daily Pivot 483.30 Trend bias line
S1 (1st Support) 475.25 Immediate support
S2 467.20 Next downside cushion
S3 459.15 Major support zone
👉 Interpretation (1-day frame):
Price above pivot (~483-484) = bullish bias on the daily.
Near-term resistance cluster: ₹491–₹499–₹507 — watch breakout closes above these for continuation.
Downside support cluster: ₹475 → ₹467 → ₹459 — breakdown below these suggests short-term correction.
📊 Short Summary (Daily Momentum & Indicators)
Technical bias:
• RSI near bullish/neutral zone — showing positive momentum without being extremely overbought.
• MACD / ADX generally leaning bullish indicating trend strength at the moment.
Overall daily structure favors bullish to sideways — supports holding and resistance being tested.
🧠 How to use these levels (Daily)
📍 Bullish setup:
• If price stays above pivot ~483 and holds above R1 (~491) → next target R2 ~499 → R3 ~507.
📍 Bearish setup:
• If price falls below pivot ~483 and breaks S1 (~475) → move down to S2 (467) & potentially S3 (459).
📍 Key breakouts:
• Clear daily close above 507 → strong bull confirmation.
• Close below 459 → negates short-term bull view.
📈 Daily Pivot & Key Levels (Classic method)
Level Price (₹) Role
R3 (3rd Resistance) 507.45 Strong upside hurdle
R2 499.40 Secondary resistance
R1 491.35 Near-term resistance
Daily Pivot 483.30 Trend bias line
S1 (1st Support) 475.25 Immediate support
S2 467.20 Next downside cushion
S3 459.15 Major support zone
👉 Interpretation (1-day frame):
Price above pivot (~483-484) = bullish bias on the daily.
Near-term resistance cluster: ₹491–₹499–₹507 — watch breakout closes above these for continuation.
Downside support cluster: ₹475 → ₹467 → ₹459 — breakdown below these suggests short-term correction.
📊 Short Summary (Daily Momentum & Indicators)
Technical bias:
• RSI near bullish/neutral zone — showing positive momentum without being extremely overbought.
• MACD / ADX generally leaning bullish indicating trend strength at the moment.
Overall daily structure favors bullish to sideways — supports holding and resistance being tested.
🧠 How to use these levels (Daily)
📍 Bullish setup:
• If price stays above pivot ~483 and holds above R1 (~491) → next target R2 ~499 → R3 ~507.
📍 Bearish setup:
• If price falls below pivot ~483 and breaks S1 (~475) → move down to S2 (467) & potentially S3 (459).
📍 Key breakouts:
• Clear daily close above 507 → strong bull confirmation.
• Close below 459 → negates short-term bull view.

Contact Knowledgehub for a detailed consultation: Dm on WhatsApp: [wa.link/a2o0kz]-
Phone No: [+91 93102 26243]-
Email: [tradingviewknowledgehub@gmail.com]---
-- Let’s achieve success together!
Phone No: [+91 93102 26243]-
Email: [tradingviewknowledgehub@gmail.com]---
-- Let’s achieve success together!
การนำเสนอที่เกี่ยวข้อง
คำจำกัดสิทธิ์ความรับผิดชอบ
ข้อมูลและบทความไม่ได้มีวัตถุประสงค์เพื่อก่อให้เกิดกิจกรรมทางการเงิน, การลงทุน, การซื้อขาย, ข้อเสนอแนะ หรือคำแนะนำประเภทอื่น ๆ ที่ให้หรือรับรองโดย TradingView อ่านเพิ่มเติมใน ข้อกำหนดการใช้งาน
Contact Knowledgehub for a detailed consultation: Dm on WhatsApp: [wa.link/a2o0kz]-
Phone No: [+91 93102 26243]-
Email: [tradingviewknowledgehub@gmail.com]---
-- Let’s achieve success together!
Phone No: [+91 93102 26243]-
Email: [tradingviewknowledgehub@gmail.com]---
-- Let’s achieve success together!
การนำเสนอที่เกี่ยวข้อง
คำจำกัดสิทธิ์ความรับผิดชอบ
ข้อมูลและบทความไม่ได้มีวัตถุประสงค์เพื่อก่อให้เกิดกิจกรรมทางการเงิน, การลงทุน, การซื้อขาย, ข้อเสนอแนะ หรือคำแนะนำประเภทอื่น ๆ ที่ให้หรือรับรองโดย TradingView อ่านเพิ่มเติมใน ข้อกำหนดการใช้งาน