
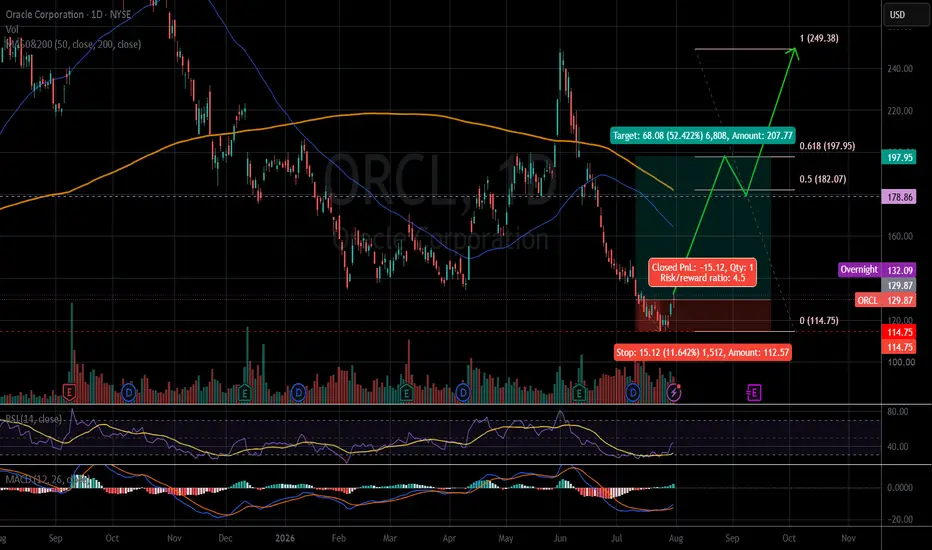
The weekly chart shows a bullish divergence with the RSI.
There were signs of a price increase last week, according to the RSI and MACD indicators.
The price closed on 07.31.2026: $129.87.
Price target: $197.95/ $249.38
Stop loss: $114.75 (-11.6%)
R/R: 4.5
IMO, amateur trader.
Good luck!
There were signs of a price increase last week, according to the RSI and MACD indicators.
The price closed on 07.31.2026: $129.87.
Price target: $197.95/ $249.38
Stop loss: $114.75 (-11.6%)
R/R: 4.5
IMO, amateur trader.
Good luck!

คำจำกัดสิทธิ์ความรับผิดชอบ
ข้อมูลและบทความไม่ได้มีวัตถุประสงค์เพื่อก่อให้เกิดกิจกรรมทางการเงิน, การลงทุน, การซื้อขาย, ข้อเสนอแนะ หรือคำแนะนำประเภทอื่น ๆ ที่ให้หรือรับรองโดย TradingView อ่านเพิ่มเติมใน ข้อกำหนดการใช้งาน
คำจำกัดสิทธิ์ความรับผิดชอบ
ข้อมูลและบทความไม่ได้มีวัตถุประสงค์เพื่อก่อให้เกิดกิจกรรมทางการเงิน, การลงทุน, การซื้อขาย, ข้อเสนอแนะ หรือคำแนะนำประเภทอื่น ๆ ที่ให้หรือรับรองโดย TradingView อ่านเพิ่มเติมใน ข้อกำหนดการใช้งาน