
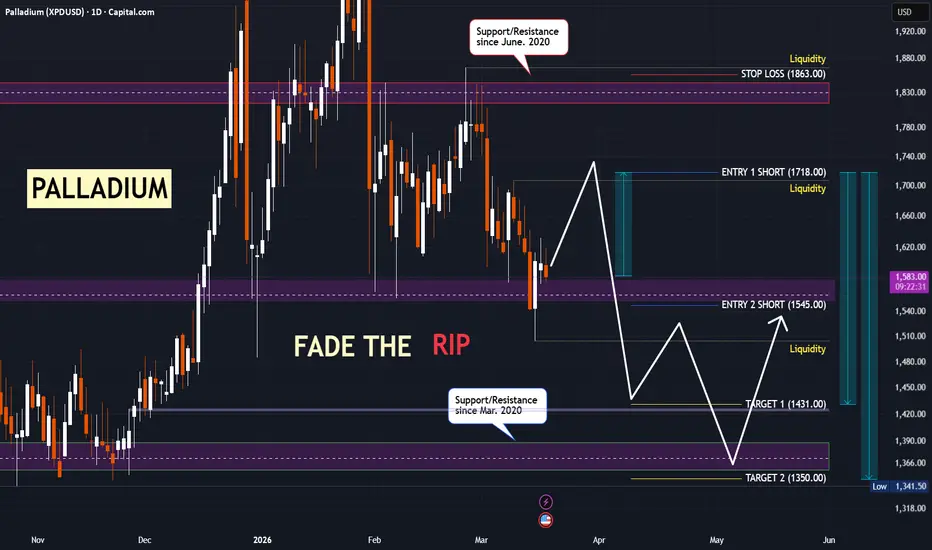
Seven failed attempts to break support have created a dangerous illusion of safety for the bulls. While the market prepares for a liquidity hunt to $1710.00, the underlying structure points to a classic "trap-and-drop" sequence that could catch many off guard.
# - - - - -
Technicals:
1. Palladium is currently trading near a local high within a broad medium-term range of [$1360.00, $1845.00].
2. Since 2020, the lower boundary [$1360, $1390] (S/R Mar. 2020) and the upper boundary [$1815.00, $1845.00] (S/R June 2020) have REPEATEDLY served as support and resistance zones, depending on the market context.
3. After establishing a local high at $2129.00 and failing to sustain price action above [$1815.00, $1845.00], the price has been moving within a descending sideways range.
4. In February and March 2026, the price (2) twice tested the upper boundary of the channel [$1815.00, $1845.00] with false breakouts, followed by a descending trend correction.
5. As of today (March 18, 2026), the median line of the medium-term channel [$1360.00, $1845.00] is acting as the primary support zone. Since January 2026, the price has made 7 (SEVEN!) attempts to break through this [$1545.00, $1575.00] zone on the 1D TF.
This indicates three key things:
- This support zone is exceptionally strong in the local picture and serves as a main point for determining the local trend.
- Should buyers hold this zone, the price may attempt a bounce toward [$1692.00, $1746.00] to collect liquidity, with a maximum target of retesting $1815.00.
- In the event of a final breakdown and a confirmed close below $1545.00, the price will head toward $1370.00.
# - - - - -
Conclusion:
In the medium term, the probability of continued downward movement toward $1350.00 is higher than a reversal and a continuation of the bullish trend.
The setup outlines 2 potential price action scenarios:
# - - - - -
Scenario 1: Price gets locally rejected from the [$1545.00, $1575.00] zone
(Trigger: Entry ONLY after confirmation of a $1710.00 liquidity collection and weak price structure—evidenced by choppy movements or numerous upper wicks).
✅ Entry Point 1 SHORT: $1718.00
🛑 Stop-Loss: $1863.00
🤑 Target 1: $1431.00
🤑 Target 2: $1350.00
Continuous trading for 2-3 days at or above the [$1815.00, $1845.00] zone will signal an upcoming breakout and bull trend continuation, invalidating this scenario.
# - - - - -
Scenario 2: Price penetrates the psychological [$1545.00, $1575.00] zone
(Trigger: Entry after the price collects liquidity at $1515.00 and subsequently retests $1545.00 from below).
✅ Entry Point 2 SHORT: $1545.00
🛑 Stop-Loss: Above the high of the 1D candle that penetrates the zone.
🤑 Target 1: $1431.00
🤑 Target 2: $1350.00
A price close above the 1D candle that penetrates the [1545.00, 1575.00] zone invalidates the bearish continuation.
# - - - - -
Good Luck! ☺️
# - - - - -
DISCLAIMER: Not financial advice. Everyone must make trading decisions at their own risk, guided only by their own criteria and strategy for opening or not opening a trade.
# - - - - -
P.S. Everyone sees the support. Some definitely think there is a trap. I know which side I’m on. But where do you stand?
P.P.S. See analysis on other Metals in related publication on the >>>
# - - - - -
Technicals:
1. Palladium is currently trading near a local high within a broad medium-term range of [$1360.00, $1845.00].
2. Since 2020, the lower boundary [$1360, $1390] (S/R Mar. 2020) and the upper boundary [$1815.00, $1845.00] (S/R June 2020) have REPEATEDLY served as support and resistance zones, depending on the market context.
3. After establishing a local high at $2129.00 and failing to sustain price action above [$1815.00, $1845.00], the price has been moving within a descending sideways range.
4. In February and March 2026, the price (2) twice tested the upper boundary of the channel [$1815.00, $1845.00] with false breakouts, followed by a descending trend correction.
5. As of today (March 18, 2026), the median line of the medium-term channel [$1360.00, $1845.00] is acting as the primary support zone. Since January 2026, the price has made 7 (SEVEN!) attempts to break through this [$1545.00, $1575.00] zone on the 1D TF.
This indicates three key things:
- This support zone is exceptionally strong in the local picture and serves as a main point for determining the local trend.
- Should buyers hold this zone, the price may attempt a bounce toward [$1692.00, $1746.00] to collect liquidity, with a maximum target of retesting $1815.00.
- In the event of a final breakdown and a confirmed close below $1545.00, the price will head toward $1370.00.
# - - - - -
Conclusion:
In the medium term, the probability of continued downward movement toward $1350.00 is higher than a reversal and a continuation of the bullish trend.
The setup outlines 2 potential price action scenarios:
# - - - - -
Scenario 1: Price gets locally rejected from the [$1545.00, $1575.00] zone
(Trigger: Entry ONLY after confirmation of a $1710.00 liquidity collection and weak price structure—evidenced by choppy movements or numerous upper wicks).
✅ Entry Point 1 SHORT: $1718.00
🛑 Stop-Loss: $1863.00
🤑 Target 1: $1431.00
🤑 Target 2: $1350.00
Continuous trading for 2-3 days at or above the [$1815.00, $1845.00] zone will signal an upcoming breakout and bull trend continuation, invalidating this scenario.
# - - - - -
Scenario 2: Price penetrates the psychological [$1545.00, $1575.00] zone
(Trigger: Entry after the price collects liquidity at $1515.00 and subsequently retests $1545.00 from below).
✅ Entry Point 2 SHORT: $1545.00
🛑 Stop-Loss: Above the high of the 1D candle that penetrates the zone.
🤑 Target 1: $1431.00
🤑 Target 2: $1350.00
A price close above the 1D candle that penetrates the [1545.00, 1575.00] zone invalidates the bearish continuation.
# - - - - -
Good Luck! ☺️
# - - - - -
DISCLAIMER: Not financial advice. Everyone must make trading decisions at their own risk, guided only by their own criteria and strategy for opening or not opening a trade.
# - - - - -
P.S. Everyone sees the support. Some definitely think there is a trap. I know which side I’m on. But where do you stand?
P.P.S. See analysis on other Metals in related publication on the >>>
บันทึก
The price has strongly penetrated the [$1545.00, $1575.00] support zone, meaning that the 2nd scenario is in play.Looking now for S/R zone to be retested and planned Entry Point with suitable Risk-Reward
การซื้อขายยังคงดำเนินอยู่
Price reached 1st Targetปิดการเทรด: ถึงเป้าหมายการทำกำไร
Price reached second and final TPบันทึก
Looks more like trap, drop, bounce
Visit my Risk Enforcement App → mywarner.app/
Follow me on Telegram → t.me/totsamiykaa
Watch me on YT → youtube.com/@totsamiykaa
See me on Threads → threads.com/@totsamiykaa
Follow me on Telegram → t.me/totsamiykaa
Watch me on YT → youtube.com/@totsamiykaa
See me on Threads → threads.com/@totsamiykaa
การนำเสนอที่เกี่ยวข้อง
คำจำกัดสิทธิ์ความรับผิดชอบ
ข้อมูลและบทความไม่ได้มีวัตถุประสงค์เพื่อก่อให้เกิดกิจกรรมทางการเงิน, การลงทุน, การซื้อขาย, ข้อเสนอแนะ หรือคำแนะนำประเภทอื่น ๆ ที่ให้หรือรับรองโดย TradingView อ่านเพิ่มเติมใน ข้อกำหนดการใช้งาน
Visit my Risk Enforcement App → mywarner.app/
Follow me on Telegram → t.me/totsamiykaa
Watch me on YT → youtube.com/@totsamiykaa
See me on Threads → threads.com/@totsamiykaa
Follow me on Telegram → t.me/totsamiykaa
Watch me on YT → youtube.com/@totsamiykaa
See me on Threads → threads.com/@totsamiykaa
การนำเสนอที่เกี่ยวข้อง
คำจำกัดสิทธิ์ความรับผิดชอบ
ข้อมูลและบทความไม่ได้มีวัตถุประสงค์เพื่อก่อให้เกิดกิจกรรมทางการเงิน, การลงทุน, การซื้อขาย, ข้อเสนอแนะ หรือคำแนะนำประเภทอื่น ๆ ที่ให้หรือรับรองโดย TradingView อ่านเพิ่มเติมใน ข้อกำหนดการใช้งาน