
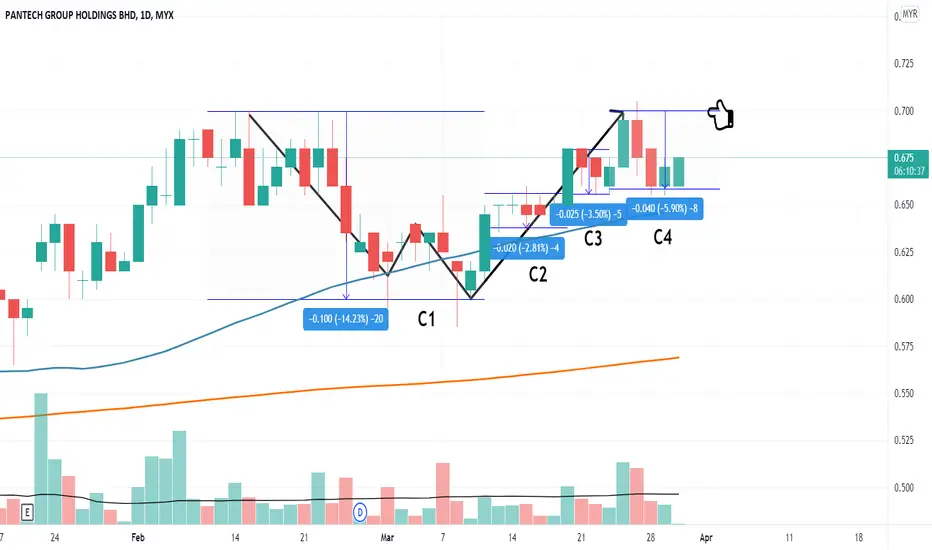
PANTECH showing VCP setup with below contraction:
C1: -14%
C2: -3%
C3: -3%
C4: -6%
At the same time, chart also showing a double bottom setup (Black line path)
Handle forming in progress. Let's see if can breakout previous high or not.
Disclaimer:
Not buy call recommendation. Technical analysis sharing based on chart pattern and trend. Trade at your own risk.
C1: -14%
C2: -3%
C3: -3%
C4: -6%
At the same time, chart also showing a double bottom setup (Black line path)
Handle forming in progress. Let's see if can breakout previous high or not.
Disclaimer:
Not buy call recommendation. Technical analysis sharing based on chart pattern and trend. Trade at your own risk.

การนำเสนอที่เกี่ยวข้อง
คำจำกัดสิทธิ์ความรับผิดชอบ
ข้อมูลและบทความไม่ได้มีวัตถุประสงค์เพื่อก่อให้เกิดกิจกรรมทางการเงิน, การลงทุน, การซื้อขาย, ข้อเสนอแนะ หรือคำแนะนำประเภทอื่น ๆ ที่ให้หรือรับรองโดย TradingView อ่านเพิ่มเติมใน ข้อกำหนดการใช้งาน
การนำเสนอที่เกี่ยวข้อง
คำจำกัดสิทธิ์ความรับผิดชอบ
ข้อมูลและบทความไม่ได้มีวัตถุประสงค์เพื่อก่อให้เกิดกิจกรรมทางการเงิน, การลงทุน, การซื้อขาย, ข้อเสนอแนะ หรือคำแนะนำประเภทอื่น ๆ ที่ให้หรือรับรองโดย TradingView อ่านเพิ่มเติมใน ข้อกำหนดการใช้งาน