
Educational wave study only. Not a buy or sell recommendation.
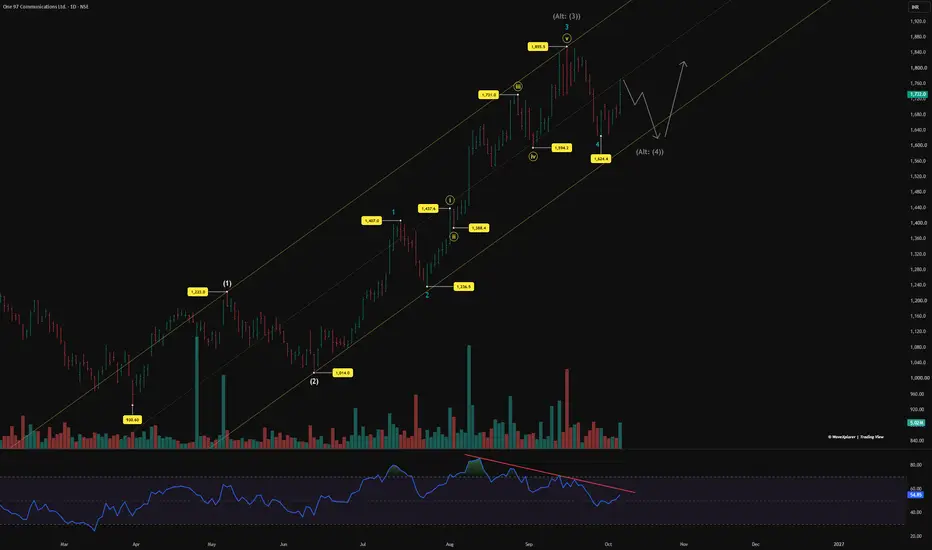
From the March low of 930.6, this stock has moved up in a clean rising channel. The waves, the volume and the RSI all tell the same story.
Wave (1) and (2): Wave (1) went from 930.6 to 1,223 in a choppy, overlapping way. It looks like a leading diagonal. Wave (2) then fell to 1,014, taking back 71.5%. A deep wave 2 is normal after a diagonal.
Wave (3) so far:
Volume and RSI: The highest volume and the highest RSI (about 88) both came in early August, in the middle of wave 3. That's where the strongest part of a third wave usually is. At 1,855.5, price made a new high but RSI made a lower high. This divergence is typical at the end of a fifth wave, here ⓥ of 3. Heavy selling volume near that top confirms it. During wave 4, RSI held above 40, which shows the uptrend is still healthy.
Main view: Wave 5 of (3) may now be starting from 1,624.4. Fibonacci measurements point to the 2,017–2,144 zone for wave (3) to complete.
Alternate view: Wave (3) may already be done at 1,855.5, and wave (4) may still be running. Wave (2) was a sharp, deep fall, so wave (4) is likely to be different: a sideways flat. In this path:
After that, wave (5) could move above 1,855.5, toward 1,917–1,978.
What to watch:
Disclaimer:
I am not a SEBI registered research analyst. This post is shared only for education and learning purposes, based on my personal reading of the chart. It is not a buy or sell recommendation. Please do your own research or speak to a registered advisor before taking any trading decision.
From the March low of 930.6, this stock has moved up in a clean rising channel. The waves, the volume and the RSI all tell the same story.
Wave (1) and (2): Wave (1) went from 930.6 to 1,223 in a choppy, overlapping way. It looks like a leading diagonal. Wave (2) then fell to 1,014, taking back 71.5%. A deep wave 2 is normal after a diagonal.
Wave (3) so far:
- Wave 1 topped at 1,407.
- Wave 2 fell to 1,236.5.
- Wave 3 ran to 1,855.5 in five smaller waves, ⓘ to ⓥ. That's about 1.618 times wave 1.
- Wave 4 ended at 1,624.4, a 38.2% pullback, close to where the smaller wave ⓘⓥ ended (1,594.2).
Volume and RSI: The highest volume and the highest RSI (about 88) both came in early August, in the middle of wave 3. That's where the strongest part of a third wave usually is. At 1,855.5, price made a new high but RSI made a lower high. This divergence is typical at the end of a fifth wave, here ⓥ of 3. Heavy selling volume near that top confirms it. During wave 4, RSI held above 40, which shows the uptrend is still healthy.
Main view: Wave 5 of (3) may now be starting from 1,624.4. Fibonacci measurements point to the 2,017–2,144 zone for wave (3) to complete.
Alternate view: Wave (3) may already be done at 1,855.5, and wave (4) may still be running. Wave (2) was a sharp, deep fall, so wave (4) is likely to be different: a sideways flat. In this path:
- 1,624.4 was wave a.
- The current bounce is wave b.
- Wave c could dip below the lower channel line, toward 1,594–1,543. That's where the smaller wave ⓘⓥ ended, where c equals a, and close to the 38.2% retracement of (3).
After that, wave (5) could move above 1,855.5, toward 1,917–1,978.
What to watch:
- RSI is now close to its falling trendline. If RSI breaks above it while price moves above 1,774, momentum has reset. That's an early sign of wave 5.
- A move above 1,855.5 confirms a new up-leg.
- A drop below 1,624.4 favours the alternate view, with the 1,594–1,543 zone as the area to watch.
- Below 1,407, the main count is wrong.
- Below 1,223, the alternate count is also wrong.
Disclaimer:
I am not a SEBI registered research analyst. This post is shared only for education and learning purposes, based on my personal reading of the chart. It is not a buy or sell recommendation. Please do your own research or speak to a registered advisor before taking any trading decision.

WaveXplorer | Elliott Wave insights
📊 X profile: @veerappa89
📊 X profile: @veerappa89
การนำเสนอที่เกี่ยวข้อง
คำจำกัดสิทธิ์ความรับผิดชอบ
ข้อมูลและบทความไม่ได้มีวัตถุประสงค์เพื่อก่อให้เกิดกิจกรรมทางการเงิน, การลงทุน, การซื้อขาย, ข้อเสนอแนะ หรือคำแนะนำประเภทอื่น ๆ ที่ให้หรือรับรองโดย TradingView อ่านเพิ่มเติมใน ข้อกำหนดการใช้งาน
WaveXplorer | Elliott Wave insights
📊 X profile: @veerappa89
📊 X profile: @veerappa89
การนำเสนอที่เกี่ยวข้อง
คำจำกัดสิทธิ์ความรับผิดชอบ
ข้อมูลและบทความไม่ได้มีวัตถุประสงค์เพื่อก่อให้เกิดกิจกรรมทางการเงิน, การลงทุน, การซื้อขาย, ข้อเสนอแนะ หรือคำแนะนำประเภทอื่น ๆ ที่ให้หรือรับรองโดย TradingView อ่านเพิ่มเติมใน ข้อกำหนดการใช้งาน