
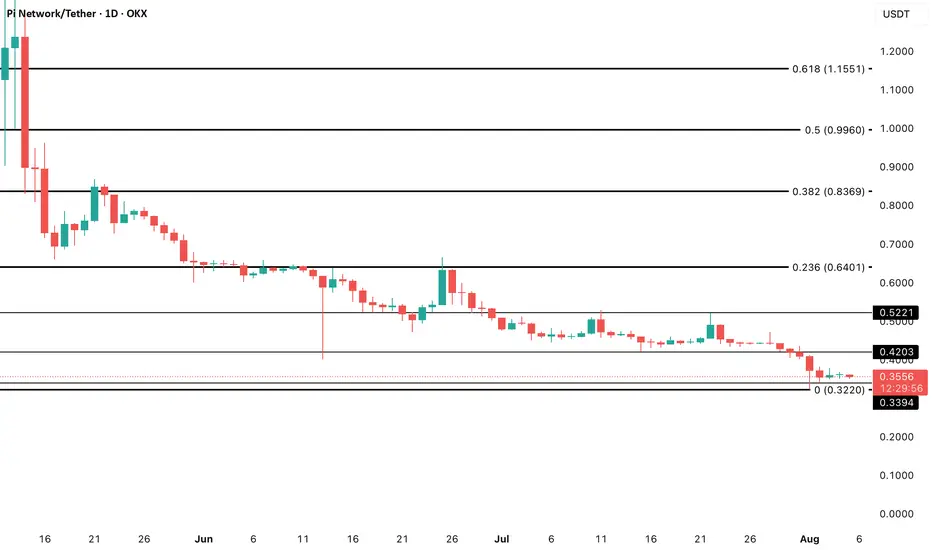
PI/USD remains locked in a sideways trend, with technical indicators on the daily chart signaling market indecision. The Relative Strength Index (RSI) has moved flatly since the consolidation began, reflecting a balance between buying and selling pressure.
An RSI reading above 70 typically signals overbought conditions, while readings below 30 indicate oversold territory — but PI’s current range shows neither extreme, suggesting traders are hesitant to take strong positions.
Similarly, the Average True Range (ATR) has been trending downward since August 2, now sitting at 0.03. This drop in volatility signals smaller, less frequent price changes.
Such ATR behavior often occurs during consolidation phases or periods of uncertainty, as market participants await a catalyst for a decisive breakout. Until then, PI’s price remains trapped between fear and hope.
An RSI reading above 70 typically signals overbought conditions, while readings below 30 indicate oversold territory — but PI’s current range shows neither extreme, suggesting traders are hesitant to take strong positions.
Similarly, the Average True Range (ATR) has been trending downward since August 2, now sitting at 0.03. This drop in volatility signals smaller, less frequent price changes.
Such ATR behavior often occurs during consolidation phases or periods of uncertainty, as market participants await a catalyst for a decisive breakout. Until then, PI’s price remains trapped between fear and hope.

Leader in crypto news, award winning journalism in 26 languages.
คำจำกัดสิทธิ์ความรับผิดชอบ
ข้อมูลและบทความไม่ได้มีวัตถุประสงค์เพื่อก่อให้เกิดกิจกรรมทางการเงิน, การลงทุน, การซื้อขาย, ข้อเสนอแนะ หรือคำแนะนำประเภทอื่น ๆ ที่ให้หรือรับรองโดย TradingView อ่านเพิ่มเติมใน ข้อกำหนดการใช้งาน
Leader in crypto news, award winning journalism in 26 languages.
คำจำกัดสิทธิ์ความรับผิดชอบ
ข้อมูลและบทความไม่ได้มีวัตถุประสงค์เพื่อก่อให้เกิดกิจกรรมทางการเงิน, การลงทุน, การซื้อขาย, ข้อเสนอแนะ หรือคำแนะนำประเภทอื่น ๆ ที่ให้หรือรับรองโดย TradingView อ่านเพิ่มเติมใน ข้อกำหนดการใช้งาน