Somewhere in another Galaxy, in late December, 2024 (yet before The Second Coming of Trump), TradingView asked at it awesome Giveaway: Happy Holidays & Merry Christmas!
Here's what we answered:
1️⃣ What was your best trade this year?
2️⃣ What is your trading goal for 2025?
It's gone three months and a half or so... (Duh..? Haha.. 3 months, really? 😸😸😸)
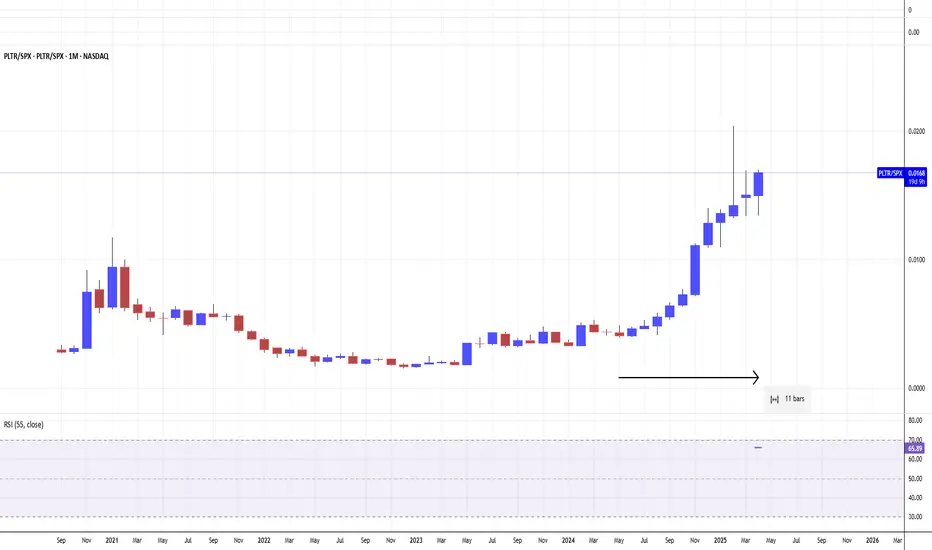
Let see what's happened next at the main graph PLTR/SPX
First of all, let me explain in a few words what does this graph mean.
Conclusion
👌 PALANTIR. THE STOCK THAT OUTPERFORMS S&P 500, 11 MONTHS IN A ROW.
👌 WERE WE RIGHT ON CONTEST AND WON IT? EXACTLY!
--
Best wishes,
Your Beloved PandorraResearch Team 😎

1️⃣ What was your best trade this year?
2️⃣ What is your trading goal for 2025?
Here's what we answered:
1️⃣ What was your best trade this year?
- Surely PalantirPLTR 💖
I followed Palantir all the year since January, 2024, from $16 per share, watch here.
Current result is 5X, to $80 per share.
Also I added more Palantir after SP500 Index inclusion in September 2024 watch here.
Current result is 2.6X, from $30 to $80 per share.
2️⃣ What is your trading goal for 2025?
- Once again, surely Palantir
It's gone three months and a half or so... (Duh..? Haha.. 3 months, really? 😸😸😸)
Let see what's happened next at the main graph PLTR/SPX
First of all, let me explain in a few words what does this graph mean.
- Rising (Blue) candle means Palantir PLTR monthly return is better vs
 SPX
SPX - Falling (Red) candle means Palantir PLTR monthly return is worse then SPX
Conclusion
👌 PALANTIR. THE STOCK THAT OUTPERFORMS S&P 500, 11 MONTHS IN A ROW.
👌 WERE WE RIGHT ON CONTEST AND WON IT? EXACTLY!
--
Best wishes,
Your Beloved PandorraResearch Team 😎

การนำเสนอที่เกี่ยวข้อง
คำจำกัดสิทธิ์ความรับผิดชอบ
ข้อมูลและบทความไม่ได้มีวัตถุประสงค์เพื่อก่อให้เกิดกิจกรรมทางการเงิน, การลงทุน, การซื้อขาย, ข้อเสนอแนะ หรือคำแนะนำประเภทอื่น ๆ ที่ให้หรือรับรองโดย TradingView อ่านเพิ่มเติมใน ข้อกำหนดการใช้งาน
การนำเสนอที่เกี่ยวข้อง
คำจำกัดสิทธิ์ความรับผิดชอบ
ข้อมูลและบทความไม่ได้มีวัตถุประสงค์เพื่อก่อให้เกิดกิจกรรมทางการเงิน, การลงทุน, การซื้อขาย, ข้อเสนอแนะ หรือคำแนะนำประเภทอื่น ๆ ที่ให้หรือรับรองโดย TradingView อ่านเพิ่มเติมใน ข้อกำหนดการใช้งาน