
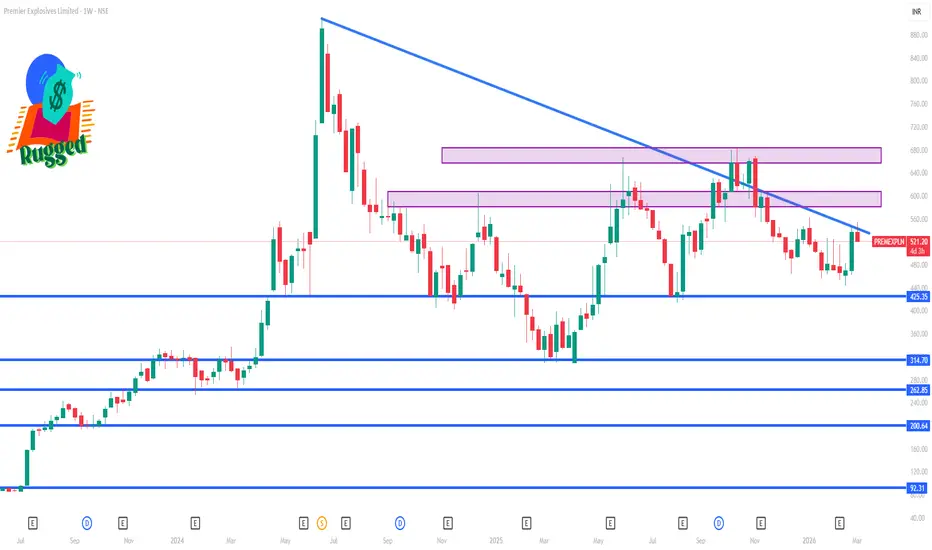
📌 Current price context (late Feb-early Mar 2026):
• Stock has been trading roughly ₹520–₹554 range recently.
📊 Key 1-Week Trading Levels
✔ Immediate Support Levels (Short-Term)
These are areas where buyers may step in if price drops this week:
• ₹500–₹505 area – central pivot zone (pivot ~509)
• ₹490–₹495 – short-term support zone just below pivot/resistance flips
• ₹471–₹475 – accumulated volume support levels & lower range support
• ₹462–₹468 – deeper support if bias weakens this week
Key short-term stop-loss reference (if selling intensifies): ~₹462–₹455 area.
📈 Resistance Levels to Watch This Week
These are zones that may cap upside:
• ₹512–₹518 – pivot-turned resistance zone (important short-term hurdle)
• ₹524–₹532 – next resistance zone if momentum picks up
• ₹540–₹550+ – recent high cluster range — strong resistance above current price
Strong upside break level: A sustained close above ₹550–₹555 may open further momentum.
📌 Short-Term Bias Notes
📉 Technical indicators (TradingView) show mixed to neutral signals in the short term, with overall rating tilting sell on 1-week timeframe — indicating caution if the price fails to reclaim above immediate resistance.
📊 Based on pivot and volume support analysis, downside risk increases only if the stock closes below the ₹470–₹468 zone this week.
• Stock has been trading roughly ₹520–₹554 range recently.
📊 Key 1-Week Trading Levels
✔ Immediate Support Levels (Short-Term)
These are areas where buyers may step in if price drops this week:
• ₹500–₹505 area – central pivot zone (pivot ~509)
• ₹490–₹495 – short-term support zone just below pivot/resistance flips
• ₹471–₹475 – accumulated volume support levels & lower range support
• ₹462–₹468 – deeper support if bias weakens this week
Key short-term stop-loss reference (if selling intensifies): ~₹462–₹455 area.
📈 Resistance Levels to Watch This Week
These are zones that may cap upside:
• ₹512–₹518 – pivot-turned resistance zone (important short-term hurdle)
• ₹524–₹532 – next resistance zone if momentum picks up
• ₹540–₹550+ – recent high cluster range — strong resistance above current price
Strong upside break level: A sustained close above ₹550–₹555 may open further momentum.
📌 Short-Term Bias Notes
📉 Technical indicators (TradingView) show mixed to neutral signals in the short term, with overall rating tilting sell on 1-week timeframe — indicating caution if the price fails to reclaim above immediate resistance.
📊 Based on pivot and volume support analysis, downside risk increases only if the stock closes below the ₹470–₹468 zone this week.

Contact Knowledgehub for a detailed consultation: Dm on WhatsApp: [wa.link/a2o0kz]-
Phone No: [+91 93102 26243]-
Email: [tradingviewknowledgehub@gmail.com]---
-- Let’s achieve success together!
Phone No: [+91 93102 26243]-
Email: [tradingviewknowledgehub@gmail.com]---
-- Let’s achieve success together!
การนำเสนอที่เกี่ยวข้อง
คำจำกัดสิทธิ์ความรับผิดชอบ
ข้อมูลและบทความไม่ได้มีวัตถุประสงค์เพื่อก่อให้เกิดกิจกรรมทางการเงิน, การลงทุน, การซื้อขาย, ข้อเสนอแนะ หรือคำแนะนำประเภทอื่น ๆ ที่ให้หรือรับรองโดย TradingView อ่านเพิ่มเติมใน ข้อกำหนดการใช้งาน
Contact Knowledgehub for a detailed consultation: Dm on WhatsApp: [wa.link/a2o0kz]-
Phone No: [+91 93102 26243]-
Email: [tradingviewknowledgehub@gmail.com]---
-- Let’s achieve success together!
Phone No: [+91 93102 26243]-
Email: [tradingviewknowledgehub@gmail.com]---
-- Let’s achieve success together!
การนำเสนอที่เกี่ยวข้อง
คำจำกัดสิทธิ์ความรับผิดชอบ
ข้อมูลและบทความไม่ได้มีวัตถุประสงค์เพื่อก่อให้เกิดกิจกรรมทางการเงิน, การลงทุน, การซื้อขาย, ข้อเสนอแนะ หรือคำแนะนำประเภทอื่น ๆ ที่ให้หรือรับรองโดย TradingView อ่านเพิ่มเติมใน ข้อกำหนดการใช้งาน