
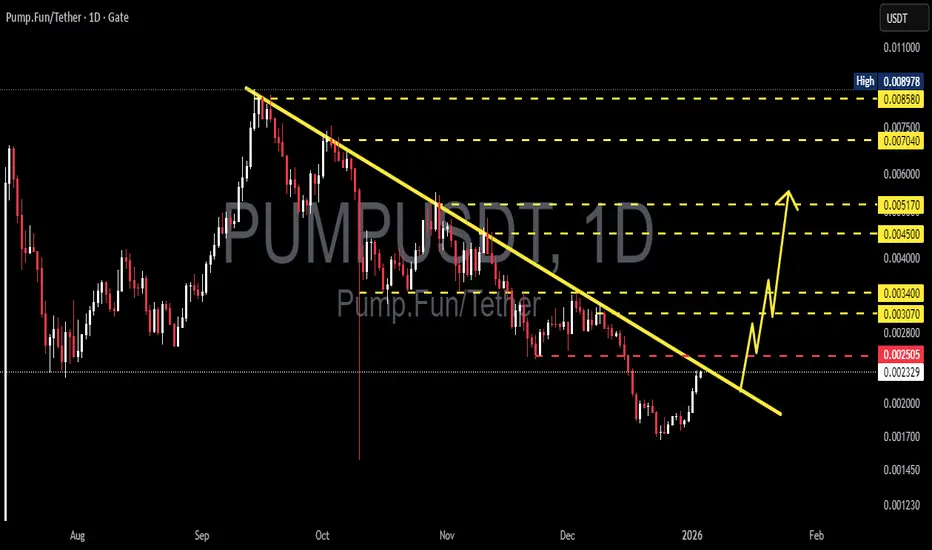
On the 1D timeframe, PUMPUSDT remains in a medium-term downtrend after failing to hold the previous high near the 0.0089 area. Price continues to form lower highs and lower lows, indicating that sellers are still in control. However, recent price action shows buyer reaction from the lower support zone, opening the possibility of a short-term recovery or trend reversal if a breakout is confirmed.
---
Pattern Explanation
Price is trading below a descending trendline (yellow line) acting as a strong dynamic resistance. This structure represents a Descending Trendline / Falling Channel setup, where:
Each bullish attempt is rejected at the trendline
Bearish momentum gradually weakens near the bottom
Price begins to form a minor higher low in late December to early January
This suggests early signs of trend exhaustion, but a valid reversal requires confirmation through a breakout.
---
Key Levels
Resistance Levels:
0.00250 → minor resistance (current reaction area)
0.00307 → mid resistance
0.00340 → key resistance
0.00450 → major resistance
0.00517 → strong supply zone
0.00704 – 0.00858 → upper resistance & previous high
Support Levels:
0.00232 → daily support
0.00205 – 0.00190 → major demand zone
0.00170 → last strong support (bullish invalidation level)
---
Bullish Scenario
A bullish scenario will be confirmed if:
Price breaks and closes above the descending trendline
A strong daily close above 0.00250 is achieved
Bullish targets:
0.00307
0.00340
0.00450
0.00517 (extended target if momentum increases)
As long as price holds above 0.00232 and breaks the trendline, trend reversal potential toward bullish continuation remains valid.
---
Bearish Scenario
The bearish scenario remains valid if:
Price fails to break the trendline
Strong rejection occurs around the 0.00250 area
Price breaks below 0.00205
Bearish targets:
0.00190
0.00170
A breakdown below 0.00170 would confirm bearish continuation and invalidate the bullish setup.
---
Conclusion
PUMPUSDT is currently at a critical decision zone. The broader structure is still bearish, but price action shows early recovery signals. The descending trendline breakout is the key confirmation for a potential trend change. Until then, any upward move should be considered a technical rebound.
---
#PUMPUSDT #PUMP #CryptoAnalysis #TechnicalAnalysis #DescendingTrendline
#BreakoutSetup #Altcoin #CryptoTrading #DailyChart #TrendReversal
#SupportResistance
---
Pattern Explanation
Price is trading below a descending trendline (yellow line) acting as a strong dynamic resistance. This structure represents a Descending Trendline / Falling Channel setup, where:
Each bullish attempt is rejected at the trendline
Bearish momentum gradually weakens near the bottom
Price begins to form a minor higher low in late December to early January
This suggests early signs of trend exhaustion, but a valid reversal requires confirmation through a breakout.
---
Key Levels
Resistance Levels:
0.00250 → minor resistance (current reaction area)
0.00307 → mid resistance
0.00340 → key resistance
0.00450 → major resistance
0.00517 → strong supply zone
0.00704 – 0.00858 → upper resistance & previous high
Support Levels:
0.00232 → daily support
0.00205 – 0.00190 → major demand zone
0.00170 → last strong support (bullish invalidation level)
---
Bullish Scenario
A bullish scenario will be confirmed if:
Price breaks and closes above the descending trendline
A strong daily close above 0.00250 is achieved
Bullish targets:
0.00307
0.00340
0.00450
0.00517 (extended target if momentum increases)
As long as price holds above 0.00232 and breaks the trendline, trend reversal potential toward bullish continuation remains valid.
---
Bearish Scenario
The bearish scenario remains valid if:
Price fails to break the trendline
Strong rejection occurs around the 0.00250 area
Price breaks below 0.00205
Bearish targets:
0.00190
0.00170
A breakdown below 0.00170 would confirm bearish continuation and invalidate the bullish setup.
---
Conclusion
PUMPUSDT is currently at a critical decision zone. The broader structure is still bearish, but price action shows early recovery signals. The descending trendline breakout is the key confirmation for a potential trend change. Until then, any upward move should be considered a technical rebound.
---
#PUMPUSDT #PUMP #CryptoAnalysis #TechnicalAnalysis #DescendingTrendline
#BreakoutSetup #Altcoin #CryptoTrading #DailyChart #TrendReversal
#SupportResistance

✅ Get Free Signals! Join Our Telegram Channel Here: t.me/TheCryptoNuclear
✅ Twitter: twitter.com/crypto_nuclear
✅ Join Bybit : partner.bybit.com/b/nuclearvip
✅ Benefits : Lifetime Trading Fee Discount -50%
✅ Twitter: twitter.com/crypto_nuclear
✅ Join Bybit : partner.bybit.com/b/nuclearvip
✅ Benefits : Lifetime Trading Fee Discount -50%
คำจำกัดสิทธิ์ความรับผิดชอบ
ข้อมูลและบทความไม่ได้มีวัตถุประสงค์เพื่อก่อให้เกิดกิจกรรมทางการเงิน, การลงทุน, การซื้อขาย, ข้อเสนอแนะ หรือคำแนะนำประเภทอื่น ๆ ที่ให้หรือรับรองโดย TradingView อ่านเพิ่มเติมใน ข้อกำหนดการใช้งาน
✅ Get Free Signals! Join Our Telegram Channel Here: t.me/TheCryptoNuclear
✅ Twitter: twitter.com/crypto_nuclear
✅ Join Bybit : partner.bybit.com/b/nuclearvip
✅ Benefits : Lifetime Trading Fee Discount -50%
✅ Twitter: twitter.com/crypto_nuclear
✅ Join Bybit : partner.bybit.com/b/nuclearvip
✅ Benefits : Lifetime Trading Fee Discount -50%
คำจำกัดสิทธิ์ความรับผิดชอบ
ข้อมูลและบทความไม่ได้มีวัตถุประสงค์เพื่อก่อให้เกิดกิจกรรมทางการเงิน, การลงทุน, การซื้อขาย, ข้อเสนอแนะ หรือคำแนะนำประเภทอื่น ๆ ที่ให้หรือรับรองโดย TradingView อ่านเพิ่มเติมใน ข้อกำหนดการใช้งาน