
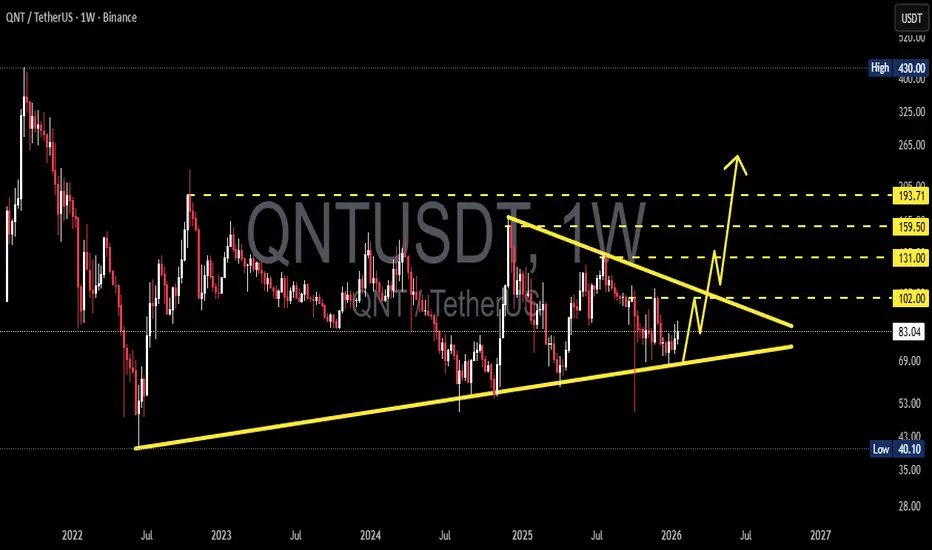
QNT/USDT on the Weekly (1W) timeframe is currently in a long-term consolidation phase after a sharp decline from its ATH, followed by progressively tightening price action. The current structure indicates a major accumulation phase, where volatility continues to contract and buying and selling pressure remain in balance.
This area represents a critical decision zone for QNT’s next major move.
---
Pattern Explanation
Price is forming a Symmetrical Triangle on the weekly timeframe, characterized by:
Lower Highs (LH) → descending resistance trendline
Higher Lows (HL) → ascending support trendline
Price range narrowing toward the apex
This pattern is neutral by nature, but it often acts as a continuation pattern of the prior trend. A breakout from this structure may trigger a strong impulsive move.
---
Key Levels
Resistance Zones:
102 USDT → minor resistance / early breakout confirmation
131 USDT → mid-level resistance
159 – 194 USDT → major resistance & strong supply zone
Support Zones:
83 USDT → current support / reaction zone
69 USDT → structural support
40 USDT → extreme support / pattern invalidation level
---
Bullish Scenario
The bullish scenario will be confirmed if:
Price breaks and closes weekly above the resistance trendline
Supported by increasing volume
Upside potential:
Initial breakout → 102 USDT
Bullish continuation → 131 USDT
Major target → 159 – 194 USDT
If the breakout is valid, this symmetrical triangle may serve as a base for a long-term trend reversal.
---
Bearish Scenario
The bearish scenario occurs if:
Price breaks down and closes weekly below the support trendline
83 USDT support fails to hold
Downside potential:
Next support → 69 USDT
Further breakdown → 40 USDT
A drop below 40 USDT would invalidate the accumulation structure and open the door for a broader bearish continuation.
---
Conclusion
QNT is currently positioned at a critical level, forming a weekly symmetrical triangle. The market is “building energy” for its next major move.
Traders and investors are advised to wait for clear breakout or breakdown confirmation, as the next direction may define QNT’s trend for the coming months.
#QNT #QNTUSDT #CryptoAnalysis #WeeklyChart #SymmetricalTriangle #MarketStructure #Breakout #SupportResistance #Altcoin
This area represents a critical decision zone for QNT’s next major move.
---
Pattern Explanation
Price is forming a Symmetrical Triangle on the weekly timeframe, characterized by:
Lower Highs (LH) → descending resistance trendline
Higher Lows (HL) → ascending support trendline
Price range narrowing toward the apex
This pattern is neutral by nature, but it often acts as a continuation pattern of the prior trend. A breakout from this structure may trigger a strong impulsive move.
---
Key Levels
Resistance Zones:
102 USDT → minor resistance / early breakout confirmation
131 USDT → mid-level resistance
159 – 194 USDT → major resistance & strong supply zone
Support Zones:
83 USDT → current support / reaction zone
69 USDT → structural support
40 USDT → extreme support / pattern invalidation level
---
Bullish Scenario
The bullish scenario will be confirmed if:
Price breaks and closes weekly above the resistance trendline
Supported by increasing volume
Upside potential:
Initial breakout → 102 USDT
Bullish continuation → 131 USDT
Major target → 159 – 194 USDT
If the breakout is valid, this symmetrical triangle may serve as a base for a long-term trend reversal.
---
Bearish Scenario
The bearish scenario occurs if:
Price breaks down and closes weekly below the support trendline
83 USDT support fails to hold
Downside potential:
Next support → 69 USDT
Further breakdown → 40 USDT
A drop below 40 USDT would invalidate the accumulation structure and open the door for a broader bearish continuation.
---
Conclusion
QNT is currently positioned at a critical level, forming a weekly symmetrical triangle. The market is “building energy” for its next major move.
Traders and investors are advised to wait for clear breakout or breakdown confirmation, as the next direction may define QNT’s trend for the coming months.
#QNT #QNTUSDT #CryptoAnalysis #WeeklyChart #SymmetricalTriangle #MarketStructure #Breakout #SupportResistance #Altcoin

✅ Get Free Signals! Join Our Telegram Channel Here: t.me/TheCryptoNuclear
✅ Twitter: twitter.com/crypto_nuclear
✅ Join Bybit : partner.bybit.com/b/nuclearvip
✅ Benefits : Lifetime Trading Fee Discount -50%
✅ Twitter: twitter.com/crypto_nuclear
✅ Join Bybit : partner.bybit.com/b/nuclearvip
✅ Benefits : Lifetime Trading Fee Discount -50%
คำจำกัดสิทธิ์ความรับผิดชอบ
ข้อมูลและบทความไม่ได้มีวัตถุประสงค์เพื่อก่อให้เกิดกิจกรรมทางการเงิน, การลงทุน, การซื้อขาย, ข้อเสนอแนะ หรือคำแนะนำประเภทอื่น ๆ ที่ให้หรือรับรองโดย TradingView อ่านเพิ่มเติมใน ข้อกำหนดการใช้งาน
✅ Get Free Signals! Join Our Telegram Channel Here: t.me/TheCryptoNuclear
✅ Twitter: twitter.com/crypto_nuclear
✅ Join Bybit : partner.bybit.com/b/nuclearvip
✅ Benefits : Lifetime Trading Fee Discount -50%
✅ Twitter: twitter.com/crypto_nuclear
✅ Join Bybit : partner.bybit.com/b/nuclearvip
✅ Benefits : Lifetime Trading Fee Discount -50%
คำจำกัดสิทธิ์ความรับผิดชอบ
ข้อมูลและบทความไม่ได้มีวัตถุประสงค์เพื่อก่อให้เกิดกิจกรรมทางการเงิน, การลงทุน, การซื้อขาย, ข้อเสนอแนะ หรือคำแนะนำประเภทอื่น ๆ ที่ให้หรือรับรองโดย TradingView อ่านเพิ่มเติมใน ข้อกำหนดการใช้งาน