Long
RFN RFN RFN
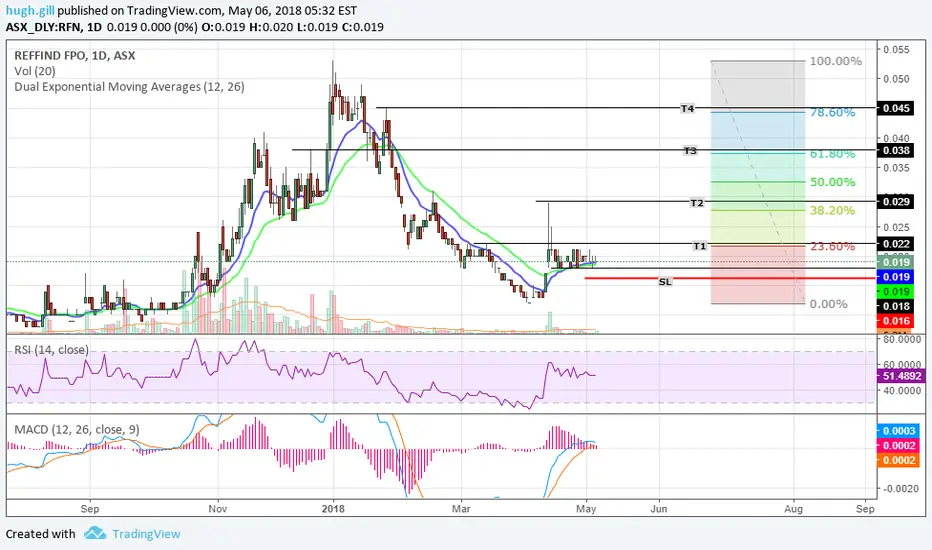
RFN is currently trading above the 26 period EMA which it historically used as a support/resistance.
The 12 and 26 period EMA has crossed with sellers drying up on the pull back. Gives a potential Bull flag on Weekly chart.
Look for Bear MACD cross on daily for an indication of a further pull back.
Tight stoploss @ 16 and long term target marked with T1,2,3,4 etc.. Relative fib levels should be used a guided profit target levels.
Safer to wait for break of 21 cent on good volume to confirm uptrend.
The 12 and 26 period EMA has crossed with sellers drying up on the pull back. Gives a potential Bull flag on Weekly chart.
Look for Bear MACD cross on daily for an indication of a further pull back.
Tight stoploss @ 16 and long term target marked with T1,2,3,4 etc.. Relative fib levels should be used a guided profit target levels.
Safer to wait for break of 21 cent on good volume to confirm uptrend.
การซื้อขายยังคงดำเนินอยู่
Potential MACD convergence on Weekly and pulling back on decreasing volume. Setting up a potential Bull Flag??

การนำเสนอที่เกี่ยวข้อง
คำจำกัดสิทธิ์ความรับผิดชอบ
ข้อมูลและบทความไม่ได้มีวัตถุประสงค์เพื่อก่อให้เกิดกิจกรรมทางการเงิน, การลงทุน, การซื้อขาย, ข้อเสนอแนะ หรือคำแนะนำประเภทอื่น ๆ ที่ให้หรือรับรองโดย TradingView อ่านเพิ่มเติมใน ข้อกำหนดการใช้งาน
การนำเสนอที่เกี่ยวข้อง
คำจำกัดสิทธิ์ความรับผิดชอบ
ข้อมูลและบทความไม่ได้มีวัตถุประสงค์เพื่อก่อให้เกิดกิจกรรมทางการเงิน, การลงทุน, การซื้อขาย, ข้อเสนอแนะ หรือคำแนะนำประเภทอื่น ๆ ที่ให้หรือรับรองโดย TradingView อ่านเพิ่มเติมใน ข้อกำหนดการใช้งาน