
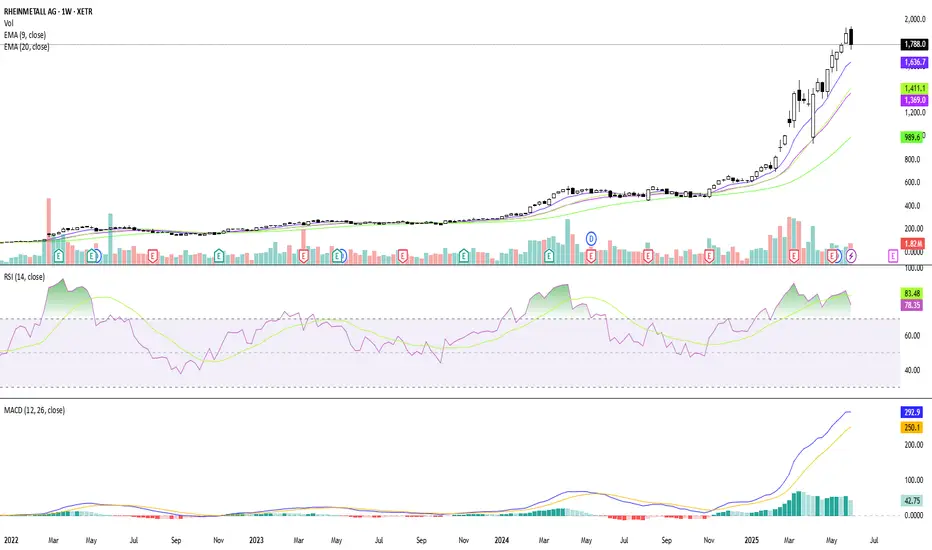
This chart is part of my active trading analysis on Rheinmetall (RHM.DE), focusing on both intraday movements and short-term trends (2–5 days).
Included Indicators:
EMA (9, 20, 50) – to assess momentum and dynamic support/resistance
RSI (14) – for overbought/oversold levels
MACD – to detect potential trend reversals
Volume – for confirmation of breakouts or fading moves
Included Indicators:
EMA (9, 20, 50) – to assess momentum and dynamic support/resistance
RSI (14) – for overbought/oversold levels
MACD – to detect potential trend reversals
Volume – for confirmation of breakouts or fading moves

คำจำกัดสิทธิ์ความรับผิดชอบ
ข้อมูลและบทความไม่ได้มีวัตถุประสงค์เพื่อก่อให้เกิดกิจกรรมทางการเงิน, การลงทุน, การซื้อขาย, ข้อเสนอแนะ หรือคำแนะนำประเภทอื่น ๆ ที่ให้หรือรับรองโดย TradingView อ่านเพิ่มเติมใน ข้อกำหนดการใช้งาน
คำจำกัดสิทธิ์ความรับผิดชอบ
ข้อมูลและบทความไม่ได้มีวัตถุประสงค์เพื่อก่อให้เกิดกิจกรรมทางการเงิน, การลงทุน, การซื้อขาย, ข้อเสนอแนะ หรือคำแนะนำประเภทอื่น ๆ ที่ให้หรือรับรองโดย TradingView อ่านเพิ่มเติมใน ข้อกำหนดการใช้งาน