
1. The Macro Perspective: The Multi-Year Accumulation Base
I am taking a LONG bias on Ryman Hospitality Properties, Inc. (RHP) on the macro monthly (1M) timeframe.
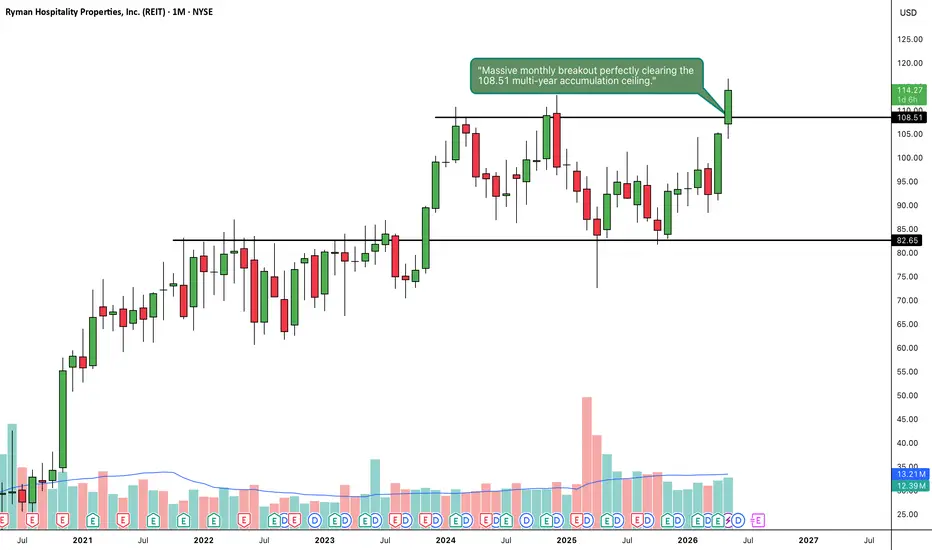
When analyzing pure market structure on a real estate investment trust (REIT), massive multi-year accumulation bases are critical for initiating long-term secular trends. Look at the comprehensive structural development displayed across this chart. Following an initial markup phase out of the pandemic lows, RHP entered a massive, multi-year horizontal digestion cycle. The stock formed a high-level accumulation block firmly bounded by a heavy structural support floor near 82.65 and a formidable overhead resistance ceiling at 108.51. This sideways consolidation effectively absorbed profit-taking and allowed institutional capital to quietly accumulate shares over several years. Fundamentally, this technical momentum aligns with Ryman's recent Q1 2026 earnings report, where the company reported strong revenue of $664.6 million and a basic EPS of $1.12. Furthermore, Ryman recently declared a second-quarter cash dividend of $1.20 per share, reinforcing its robust financial position.
2. The Educational Setup: Horizontal Boundary Defense
To understand the technical validity behind this macro launch, look closely at how the price structure interacted with its core boundaries prior to breaking out:
The 108.51 Resistance Ceiling: The definitive line in the sand for a bullish continuation was the solid black horizontal resistance line drawn at 108.51. As the price tested this line multiple times since early 2024, it established a clear, heavy supply zone that systematically rejected upward expansion.
The 82.65 Structural Floor: During the multi-year consolidation block, sellers repeatedly tried to push the price lower but were aggressively halted at the 82.65 support line. This created a robust, unbreakable accumulation floor where strong-handed portfolios defended the primary trend, allowing the monthly moving averages to eventually catch up.
3. Current Price Action: Breakout and Volatility Expansion
Look at the most recent monthly candle on the far right of the chart. The structural pressure cooker has officially exploded. Institutional buyers have stepped in with undeniable conviction, printing a massive, full-bodied green expansion candle that has vertically surged to 114.55 (+9.00%). This explosive thrust has decisively obliterated the 108.51 multi-year ceiling. Furthermore, the price has violently pierced the upper Bollinger Band, confirming that the asset has officially transitioned out of low-volatility accumulation and into a highly explosive, high-volatility secular markup trend, entering pure price discovery territory.
4. The Trade Plan: Entries, Targets, and Risk Management
Entry Strategy: Macro momentum is exceptionally strong with the stock trading vertically out in the open. Chasing an extended monthly breakout candle completely outside the upper Bollinger Band carries a minor risk of a short-term, lower-timeframe mean-reversion pullback. The highest-probability, lowest-risk entry strategy involves stepping down to the weekly timeframe and waiting for the initial vertical excitement to cool off. Look to scale into long positions or place limit orders to catch a potential pullback to perfectly retest the broken 106.00 to 109.00 prior resistance zone. Letting old historical resistance prove itself as a concrete new support floor provides an unmatched risk-to-reward ratio.
Take Profit (Targets): Because the stock is clearing a major multi-year structure to launch into pure price discovery, we use a measured move strategy based on the depth of the accumulation base. By taking the absolute depth of the horizontal range (roughly 26 points from the 82.65 floor up to the 108.51 ceiling) and projecting it upward from the breakout point, our primary structural macro target sits comfortably in the 134.00 to 135.00 zone over the coming quarters.
Invalidation (Stop Loss): An explosive macro breakout thesis is completely invalidated if the price fails to hold its newly claimed structural floor and collapses back inside the core of the base boundaries. A hard stop loss should be placed safely below the recent lower-timeframe swing lows, specifically around the 95.00 to 98.00 level. A definitive monthly close completely back below 95.00 would act as a severe warning sign of a failed macro breakout and a major bull trap.
5. Time Horizon:
Because this technical setup is built on a 1-Month chart capturing a massive structural phase transition and an all-time high horizontal breakout, this is a longer-term position trade designed to capture a secular markup phase over the coming months and quarters. Let the macro trend run!
I am taking a LONG bias on Ryman Hospitality Properties, Inc. (RHP) on the macro monthly (1M) timeframe.
When analyzing pure market structure on a real estate investment trust (REIT), massive multi-year accumulation bases are critical for initiating long-term secular trends. Look at the comprehensive structural development displayed across this chart. Following an initial markup phase out of the pandemic lows, RHP entered a massive, multi-year horizontal digestion cycle. The stock formed a high-level accumulation block firmly bounded by a heavy structural support floor near 82.65 and a formidable overhead resistance ceiling at 108.51. This sideways consolidation effectively absorbed profit-taking and allowed institutional capital to quietly accumulate shares over several years. Fundamentally, this technical momentum aligns with Ryman's recent Q1 2026 earnings report, where the company reported strong revenue of $664.6 million and a basic EPS of $1.12. Furthermore, Ryman recently declared a second-quarter cash dividend of $1.20 per share, reinforcing its robust financial position.
2. The Educational Setup: Horizontal Boundary Defense
To understand the technical validity behind this macro launch, look closely at how the price structure interacted with its core boundaries prior to breaking out:
The 108.51 Resistance Ceiling: The definitive line in the sand for a bullish continuation was the solid black horizontal resistance line drawn at 108.51. As the price tested this line multiple times since early 2024, it established a clear, heavy supply zone that systematically rejected upward expansion.
The 82.65 Structural Floor: During the multi-year consolidation block, sellers repeatedly tried to push the price lower but were aggressively halted at the 82.65 support line. This created a robust, unbreakable accumulation floor where strong-handed portfolios defended the primary trend, allowing the monthly moving averages to eventually catch up.
3. Current Price Action: Breakout and Volatility Expansion
Look at the most recent monthly candle on the far right of the chart. The structural pressure cooker has officially exploded. Institutional buyers have stepped in with undeniable conviction, printing a massive, full-bodied green expansion candle that has vertically surged to 114.55 (+9.00%). This explosive thrust has decisively obliterated the 108.51 multi-year ceiling. Furthermore, the price has violently pierced the upper Bollinger Band, confirming that the asset has officially transitioned out of low-volatility accumulation and into a highly explosive, high-volatility secular markup trend, entering pure price discovery territory.
4. The Trade Plan: Entries, Targets, and Risk Management
Entry Strategy: Macro momentum is exceptionally strong with the stock trading vertically out in the open. Chasing an extended monthly breakout candle completely outside the upper Bollinger Band carries a minor risk of a short-term, lower-timeframe mean-reversion pullback. The highest-probability, lowest-risk entry strategy involves stepping down to the weekly timeframe and waiting for the initial vertical excitement to cool off. Look to scale into long positions or place limit orders to catch a potential pullback to perfectly retest the broken 106.00 to 109.00 prior resistance zone. Letting old historical resistance prove itself as a concrete new support floor provides an unmatched risk-to-reward ratio.
Take Profit (Targets): Because the stock is clearing a major multi-year structure to launch into pure price discovery, we use a measured move strategy based on the depth of the accumulation base. By taking the absolute depth of the horizontal range (roughly 26 points from the 82.65 floor up to the 108.51 ceiling) and projecting it upward from the breakout point, our primary structural macro target sits comfortably in the 134.00 to 135.00 zone over the coming quarters.
Invalidation (Stop Loss): An explosive macro breakout thesis is completely invalidated if the price fails to hold its newly claimed structural floor and collapses back inside the core of the base boundaries. A hard stop loss should be placed safely below the recent lower-timeframe swing lows, specifically around the 95.00 to 98.00 level. A definitive monthly close completely back below 95.00 would act as a severe warning sign of a failed macro breakout and a major bull trap.
5. Time Horizon:
Because this technical setup is built on a 1-Month chart capturing a massive structural phase transition and an all-time high horizontal breakout, this is a longer-term position trade designed to capture a secular markup phase over the coming months and quarters. Let the macro trend run!

คำจำกัดสิทธิ์ความรับผิดชอบ
ข้อมูลและบทความไม่ได้มีวัตถุประสงค์เพื่อก่อให้เกิดกิจกรรมทางการเงิน, การลงทุน, การซื้อขาย, ข้อเสนอแนะ หรือคำแนะนำประเภทอื่น ๆ ที่ให้หรือรับรองโดย TradingView อ่านเพิ่มเติมใน ข้อกำหนดการใช้งาน
คำจำกัดสิทธิ์ความรับผิดชอบ
ข้อมูลและบทความไม่ได้มีวัตถุประสงค์เพื่อก่อให้เกิดกิจกรรมทางการเงิน, การลงทุน, การซื้อขาย, ข้อเสนอแนะ หรือคำแนะนำประเภทอื่น ๆ ที่ให้หรือรับรองโดย TradingView อ่านเพิ่มเติมใน ข้อกำหนดการใช้งาน