
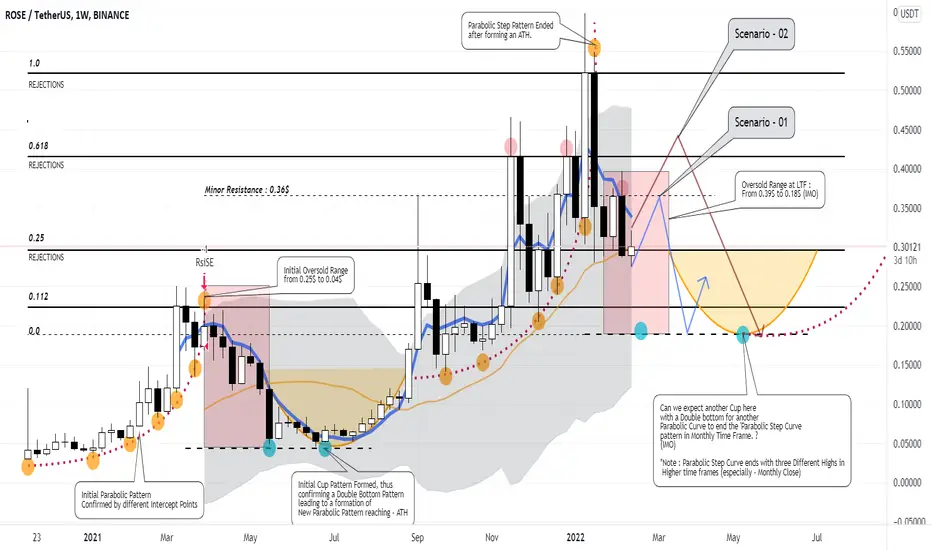
 ROSE :
One of the best charts that I worked in terms of Analysis.
Not to deny the fact that It may go completely wrong ;p but still IMO :
Scenario 1 :
It might try to break the Minor resistance line just to get rejected to reach 0.0 Lvl (0.18$) - where Imma eyeing to enter (Spot).
Scenario 2 :
It might try to break the Minor resistance line & further move up towards 0.618 Lvl (0.41$) where it may see an Oversold positions
& hence leading to 0.0Lvl (0.18$).
IMO :
ROSE may complete its Parabolic Step cure Trend after forming an ATH around 0.75$ by what it means is it should have completed smaller parabolas (which is what is shown in the chart).
Happy trading.,
Not a financial advice.
ปิดการเทรด: ถึงเป้าหมายการทำกำไร
Now., Eyeing for the Blue dot then it might form a Cup as mentioned Cheers
บันทึก
Chart is beautifully set up as predicted.0.18$ is the perfect buy zone - Spot alone

การนำเสนอที่เกี่ยวข้อง
คำจำกัดสิทธิ์ความรับผิดชอบ
ข้อมูลและบทความไม่ได้มีวัตถุประสงค์เพื่อก่อให้เกิดกิจกรรมทางการเงิน, การลงทุน, การซื้อขาย, ข้อเสนอแนะ หรือคำแนะนำประเภทอื่น ๆ ที่ให้หรือรับรองโดย TradingView อ่านเพิ่มเติมใน ข้อกำหนดการใช้งาน
คำจำกัดสิทธิ์ความรับผิดชอบ
ข้อมูลและบทความไม่ได้มีวัตถุประสงค์เพื่อก่อให้เกิดกิจกรรมทางการเงิน, การลงทุน, การซื้อขาย, ข้อเสนอแนะ หรือคำแนะนำประเภทอื่น ๆ ที่ให้หรือรับรองโดย TradingView อ่านเพิ่มเติมใน ข้อกำหนดการใช้งาน