
Russell 2000 Technical Update
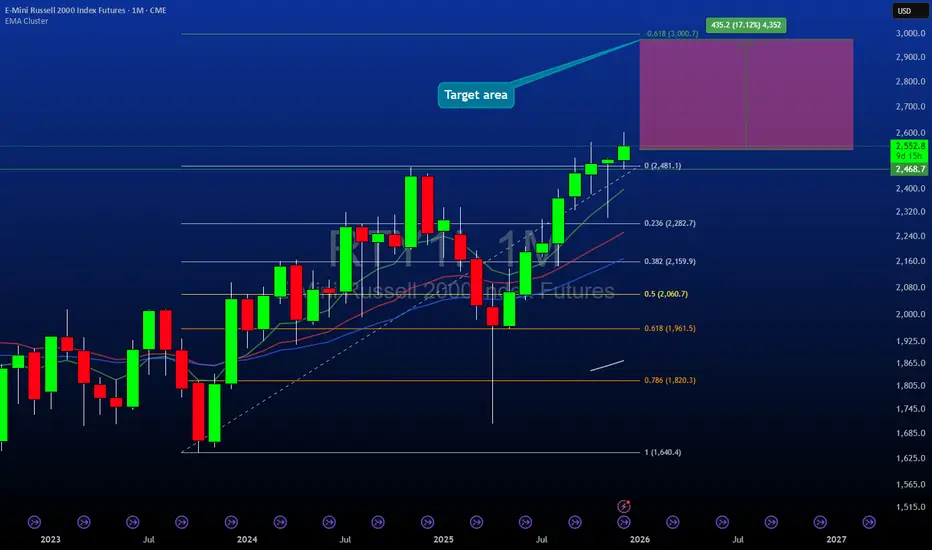
The Russell 2000 breakout from its multi year consolidation remains intact and is now confirmed by multiple monthly closes above former resistance. The anticipated pullback has played out as expected, providing validation of the breakout structure and keeping the measured move toward the 3,000 area firmly in play.
This update reviews what has developed since the original breakout signal and why the next leg higher remains the dominant path.
What Has Developed Since the Breakout
In October, the Russell 2000 recorded a monthly close above the November 2021 highs near the 2,450 area. This marked a confirmed breakout from a five year consolidation range.
At the time, a pullback to retest former resistance as support was expected. That scenario unfolded precisely.
Price retraced into the 2,280 to 2,350 zone, aligning with the 0.5 to 0.618 Fibonacci retracement levels. Buyers stepped in at support, and November closed back above the breakout level. December has continued to hold above this zone, reinforcing the validity of the move.
Two consecutive monthly closes above a five year resistance level typically signal institutional participation rather than a short term false breakout.
Current Technical Structure
Breakout Confirmation
Monthly closes remain above former resistance near 2,350. This area now acts as structural support.
Fibonacci Alignment
The pullback tested the 0.236 retracement near 2,280 and held. Price is currently trading above the 0.236 retracement, reinforcing bullish structure.
Trend Conditions
Long term moving averages are rising beneath price. Higher lows continue to form on the monthly timeframe. Volume has expanded on advances, supporting the breakout.
The initial breakout phase is complete. Price is now transitioning into the continuation phase.
Why the 3,000 Target Remains Valid
Measured Move Projection
The five year range spans roughly 1,640 to 2,481. Projecting this range from the breakout level produces an upside target above 3,300.
Conservative Targeting
Using approximately 80 percent of the measured move yields a zone near 3,150. Rounding to 3,000 provides a conservative target that accounts for volatility and market noise.
Fibonacci Extensions
Higher timeframe Fibonacci extensions cluster between 3,200 and 3,300, reinforcing the broader target zone.
From current levels near 2,400, the move to 3,000 represents approximately 25 percent upside.
Review of the November Pullback Entry
The outlined plan called for a pullback into the 2,280 to 2,350 area with invalidation below 2,150.
Price reached 2,282 in November, directly into the projected support zone. Buyers defended the level, price rebounded, and structure remained intact.
Risk to reward at entry was approximately 5 to 7 percent risk for 25 to 30 percent potential upside, producing a favorable asymmetric profile.
Why This Move Is Still Early
Cycle Timing
The breakout occurred recently on a monthly timeframe. Large structural breakouts often take 12 to 18 months to reach measured targets.
Institutional Rotation
Small caps underperformed for several years. Capital rotation into this segment typically unfolds gradually, not in a single move.
Participation Profile
Retail participation remains focused on large cap technology. Breakouts that are not yet widely discussed often offer the best continuation potential.
The breakout is confirmed, but it is not yet fully recognized.
Macro Environment
Interest Rate Outlook
Falling or stabilizing rates tend to favor small caps due to their higher sensitivity to financing costs.
Economic Backdrop
The absence of recession supports domestically focused companies that dominate the Russell 2000.
Valuation Context
Small caps continue to trade at a valuation discount relative to large caps, creating room for multiple expansion.
Technical structure and macro conditions are currently aligned.
Risk On Correlation With Crypto
Historically, sustained Russell 2000 breakouts coincide with improving liquidity conditions. These environments often support digital asset strength.
Bitcoin has already advanced meaningfully since the Russell held its breakout. Continued small cap strength would support a broader risk on regime.
This relationship is contextual rather than predictive and should be monitored rather than assumed.
Positioning Framework
Exposure Options
IWM ETF, RTY futures, or structured options depending on experience and risk tolerance.
Risk Management
A monthly close below 2,280 would weaken the breakout thesis. The 3,000 area remains the primary target, with 3,200 as an extended objective.
Time Horizon
This structure favors a medium to long term outlook rather than short term trading.
Monthly closes carry more weight than daily volatility.
Invalidation Risks
• Monthly close below 2,280
• Macro driven risk off events
• Unexpected policy tightening
• Broad market trend deterioration
If invalidated, losses remain defined and manageable relative to upside potential.
Psychology of Structural Breakouts
Early stages feel uncertain. Confirmation feels uncomfortable. Obvious trends tend to appear near the latter stages of a move.
This breakout is confirmed, but not yet crowded.
Summary
• Five year breakout confirmed with multiple monthly closes
• Support held at the anticipated retracement zone
• Measured move targets 3,000 to 3,200
• Upside approximately 25 to 30 percent from current levels
• Risk remains defined below structural support
The most difficult part of the trade was the breakout itself. The market is now in the follow through phase.
Important Disclaimer
This analysis is for educational purposes only and does not constitute financial advice. All markets involve risk, and technical patterns can fail. Always apply appropriate risk management, conduct independent research, and trade in alignment with your risk tolerance.
The Russell 2000 breakout from its multi year consolidation remains intact and is now confirmed by multiple monthly closes above former resistance. The anticipated pullback has played out as expected, providing validation of the breakout structure and keeping the measured move toward the 3,000 area firmly in play.
This update reviews what has developed since the original breakout signal and why the next leg higher remains the dominant path.
What Has Developed Since the Breakout
In October, the Russell 2000 recorded a monthly close above the November 2021 highs near the 2,450 area. This marked a confirmed breakout from a five year consolidation range.
At the time, a pullback to retest former resistance as support was expected. That scenario unfolded precisely.
Price retraced into the 2,280 to 2,350 zone, aligning with the 0.5 to 0.618 Fibonacci retracement levels. Buyers stepped in at support, and November closed back above the breakout level. December has continued to hold above this zone, reinforcing the validity of the move.
Two consecutive monthly closes above a five year resistance level typically signal institutional participation rather than a short term false breakout.
Current Technical Structure
Breakout Confirmation
Monthly closes remain above former resistance near 2,350. This area now acts as structural support.
Fibonacci Alignment
The pullback tested the 0.236 retracement near 2,280 and held. Price is currently trading above the 0.236 retracement, reinforcing bullish structure.
Trend Conditions
Long term moving averages are rising beneath price. Higher lows continue to form on the monthly timeframe. Volume has expanded on advances, supporting the breakout.
The initial breakout phase is complete. Price is now transitioning into the continuation phase.
Why the 3,000 Target Remains Valid
Measured Move Projection
The five year range spans roughly 1,640 to 2,481. Projecting this range from the breakout level produces an upside target above 3,300.
Conservative Targeting
Using approximately 80 percent of the measured move yields a zone near 3,150. Rounding to 3,000 provides a conservative target that accounts for volatility and market noise.
Fibonacci Extensions
Higher timeframe Fibonacci extensions cluster between 3,200 and 3,300, reinforcing the broader target zone.
From current levels near 2,400, the move to 3,000 represents approximately 25 percent upside.
Review of the November Pullback Entry
The outlined plan called for a pullback into the 2,280 to 2,350 area with invalidation below 2,150.
Price reached 2,282 in November, directly into the projected support zone. Buyers defended the level, price rebounded, and structure remained intact.
Risk to reward at entry was approximately 5 to 7 percent risk for 25 to 30 percent potential upside, producing a favorable asymmetric profile.
Why This Move Is Still Early
Cycle Timing
The breakout occurred recently on a monthly timeframe. Large structural breakouts often take 12 to 18 months to reach measured targets.
Institutional Rotation
Small caps underperformed for several years. Capital rotation into this segment typically unfolds gradually, not in a single move.
Participation Profile
Retail participation remains focused on large cap technology. Breakouts that are not yet widely discussed often offer the best continuation potential.
The breakout is confirmed, but it is not yet fully recognized.
Macro Environment
Interest Rate Outlook
Falling or stabilizing rates tend to favor small caps due to their higher sensitivity to financing costs.
Economic Backdrop
The absence of recession supports domestically focused companies that dominate the Russell 2000.
Valuation Context
Small caps continue to trade at a valuation discount relative to large caps, creating room for multiple expansion.
Technical structure and macro conditions are currently aligned.
Risk On Correlation With Crypto
Historically, sustained Russell 2000 breakouts coincide with improving liquidity conditions. These environments often support digital asset strength.
Bitcoin has already advanced meaningfully since the Russell held its breakout. Continued small cap strength would support a broader risk on regime.
This relationship is contextual rather than predictive and should be monitored rather than assumed.
Positioning Framework
Exposure Options
IWM ETF, RTY futures, or structured options depending on experience and risk tolerance.
Risk Management
A monthly close below 2,280 would weaken the breakout thesis. The 3,000 area remains the primary target, with 3,200 as an extended objective.
Time Horizon
This structure favors a medium to long term outlook rather than short term trading.
Monthly closes carry more weight than daily volatility.
Invalidation Risks
• Monthly close below 2,280
• Macro driven risk off events
• Unexpected policy tightening
• Broad market trend deterioration
If invalidated, losses remain defined and manageable relative to upside potential.
Psychology of Structural Breakouts
Early stages feel uncertain. Confirmation feels uncomfortable. Obvious trends tend to appear near the latter stages of a move.
This breakout is confirmed, but not yet crowded.
Summary
• Five year breakout confirmed with multiple monthly closes
• Support held at the anticipated retracement zone
• Measured move targets 3,000 to 3,200
• Upside approximately 25 to 30 percent from current levels
• Risk remains defined below structural support
The most difficult part of the trade was the breakout itself. The market is now in the follow through phase.
Important Disclaimer
This analysis is for educational purposes only and does not constitute financial advice. All markets involve risk, and technical patterns can fail. Always apply appropriate risk management, conduct independent research, and trade in alignment with your risk tolerance.

⭐ Follow the 3-Gate System - tradedesk.rbtrading.site
⭐ Prop Firm Deals - linktr.ee/rb_tradingltd
⭐ #1 Free Trading Journal Lite | +20% Off Pro code RBT20 - rbtrading.site/?ref=RBT20
⭐ Prop Firm Deals - linktr.ee/rb_tradingltd
⭐ #1 Free Trading Journal Lite | +20% Off Pro code RBT20 - rbtrading.site/?ref=RBT20
คำจำกัดสิทธิ์ความรับผิดชอบ
ข้อมูลและบทความไม่ได้มีวัตถุประสงค์เพื่อก่อให้เกิดกิจกรรมทางการเงิน, การลงทุน, การซื้อขาย, ข้อเสนอแนะ หรือคำแนะนำประเภทอื่น ๆ ที่ให้หรือรับรองโดย TradingView อ่านเพิ่มเติมใน ข้อกำหนดการใช้งาน
⭐ Follow the 3-Gate System - tradedesk.rbtrading.site
⭐ Prop Firm Deals - linktr.ee/rb_tradingltd
⭐ #1 Free Trading Journal Lite | +20% Off Pro code RBT20 - rbtrading.site/?ref=RBT20
⭐ Prop Firm Deals - linktr.ee/rb_tradingltd
⭐ #1 Free Trading Journal Lite | +20% Off Pro code RBT20 - rbtrading.site/?ref=RBT20
คำจำกัดสิทธิ์ความรับผิดชอบ
ข้อมูลและบทความไม่ได้มีวัตถุประสงค์เพื่อก่อให้เกิดกิจกรรมทางการเงิน, การลงทุน, การซื้อขาย, ข้อเสนอแนะ หรือคำแนะนำประเภทอื่น ๆ ที่ให้หรือรับรองโดย TradingView อ่านเพิ่มเติมใน ข้อกำหนดการใช้งาน