 SBI Life Insurance Co. Ltd.ที่อัปเดต:
 SBI Life Insurance Co. Ltd (NSE: SBILIFE) - Technical Analysis
Price Action and Fibonacci Analysis
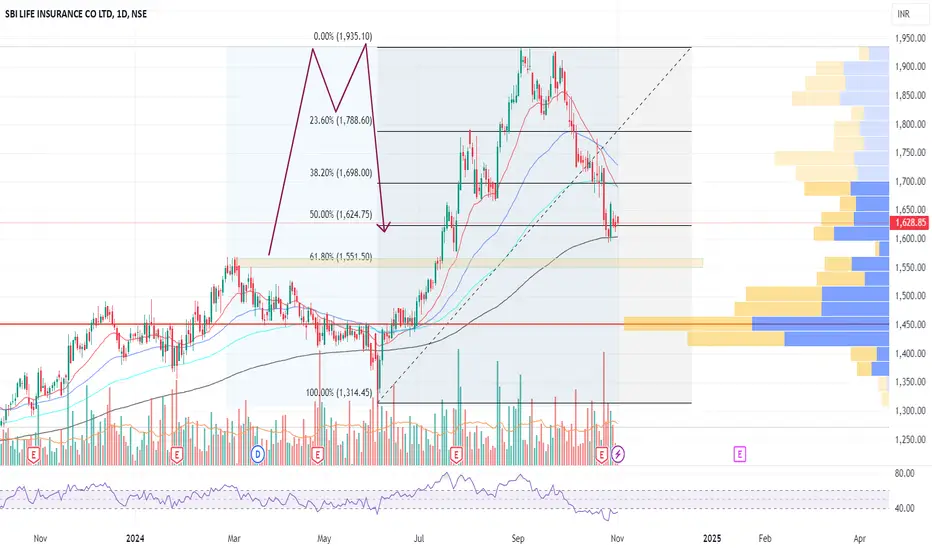
SBI Life is currently trading at ₹1,628.85, which is near a crucial Fibonacci retracement level:
1. Fibonacci Levels:
2. Volume Profile:
3. Moving Averages:
Technical Indicators
1. Relative Strength Index (RSI):
2. Volume Trends:
Conclusion and Potential Scenarios
Trading Strategy
Note: Always consider market conditions and use proper risk management techniques.
SBI Life is currently trading at ₹1,628.85, which is near a crucial Fibonacci retracement level:
1. Fibonacci Levels:
- The price previously peaked around ₹1,935.10, forming a possible double-top pattern.
- It has since retraced, approaching the 50% retracement level at ₹1,624.75, a significant support zone. This level often acts as a key point for potential rebounds.
- Below this, the 61.8% level at ₹1,551.50 is the next major support. If the price declines further, this level could provide strong support.
2. Volume Profile:
- The Volume Profile on the right suggests a high volume node around ₹1,450, indicating strong accumulation in this zone. This level, if reached, could serve as a significant support area and potential bounce point.
3. Moving Averages:
- The stock is currently trading near the 200-day moving average (black line), which may act as a long-term support level.
- The 50-day (blue) and 100-day (red) moving averages are above the current price, indicating that the stock has broken below its short- and medium-term trend lines.
Technical Indicators
1. Relative Strength Index (RSI):
- The RSI is showing signs of being in the lower half of its range but hasn’t reached oversold territory, suggesting there may be further downside before a potential rebound.
2. Volume Trends:
- There has been a significant increase in volume during the recent pullback, indicating strong selling pressure.
Conclusion and Potential Scenarios
- Bullish Scenario: If the stock holds the 50% Fibonacci level at ₹1,624.75 and the 200-day moving average, we could see a recovery toward the 38.2% level at ₹1,698.00, with further resistance at ₹1,788.60.
- Bearish Scenario: A break below ₹1,624.75 could lead the price toward the 61.8% level at ₹1,551.50. A further decline might see the price test the high-volume node around ₹1,450.
Trading Strategy
- For Long Positions: Watch for a bounce near ₹1,624.75 or ₹1,551.50 with confirmation from volume and RSI improving from lower levels.
- For Short Positions: A breakdown below ₹1,624.75, particularly with strong volume, could present a shorting opportunity down to ₹1,551.50 or potentially lower.
Note: Always consider market conditions and use proper risk management techniques.
ปิดการเทรด: ถึงเป้าหมายการทำกำไร
short target hit
คำจำกัดสิทธิ์ความรับผิดชอบ
ข้อมูลและบทความไม่ได้มีวัตถุประสงค์เพื่อก่อให้เกิดกิจกรรมทางการเงิน, การลงทุน, การซื้อขาย, ข้อเสนอแนะ หรือคำแนะนำประเภทอื่น ๆ ที่ให้หรือรับรองโดย TradingView อ่านเพิ่มเติมใน ข้อกำหนดการใช้งาน
คำจำกัดสิทธิ์ความรับผิดชอบ
ข้อมูลและบทความไม่ได้มีวัตถุประสงค์เพื่อก่อให้เกิดกิจกรรมทางการเงิน, การลงทุน, การซื้อขาย, ข้อเสนอแนะ หรือคำแนะนำประเภทอื่น ๆ ที่ให้หรือรับรองโดย TradingView อ่านเพิ่มเติมใน ข้อกำหนดการใช้งาน