
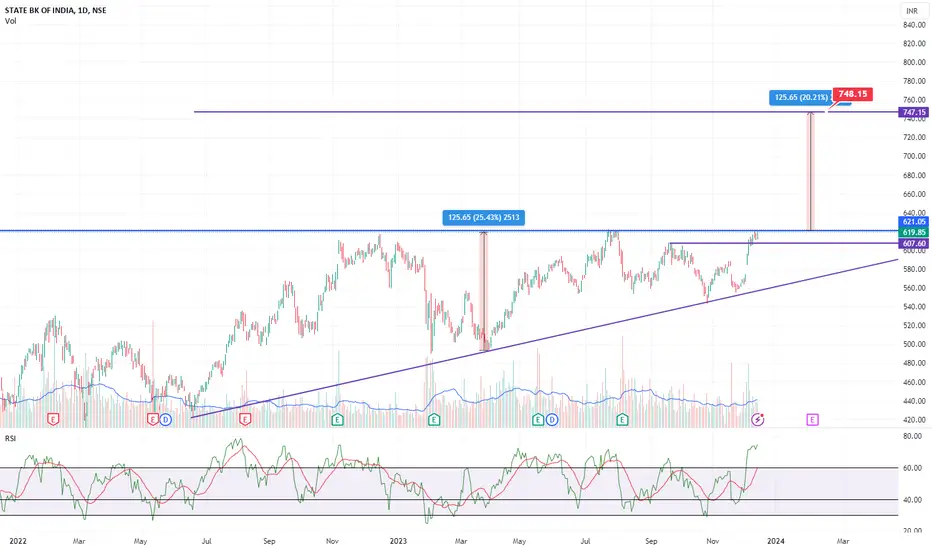
SBI form triangle pattern on weekly chart. If break and sustain above 620 weekly. It may test700-750 in next 2-3 months.
การซื้อขายยังคงดำเนินอยู่
Activeการซื้อขายยังคงดำเนินอยู่
Activeการซื้อขายยังคงดำเนินอยู่
Now all loose hand out from stock and strong hands riding towards 740. It will go festered towards target now.So stay hold
ปิดการเทรด: ถึงเป้าหมายการทำกำไร
SBI target done 740+Enjoy the bumper profit.

คำจำกัดสิทธิ์ความรับผิดชอบ
ข้อมูลและบทความไม่ได้มีวัตถุประสงค์เพื่อก่อให้เกิดกิจกรรมทางการเงิน, การลงทุน, การซื้อขาย, ข้อเสนอแนะ หรือคำแนะนำประเภทอื่น ๆ ที่ให้หรือรับรองโดย TradingView อ่านเพิ่มเติมใน ข้อกำหนดการใช้งาน
คำจำกัดสิทธิ์ความรับผิดชอบ
ข้อมูลและบทความไม่ได้มีวัตถุประสงค์เพื่อก่อให้เกิดกิจกรรมทางการเงิน, การลงทุน, การซื้อขาย, ข้อเสนอแนะ หรือคำแนะนำประเภทอื่น ๆ ที่ให้หรือรับรองโดย TradingView อ่านเพิ่มเติมใน ข้อกำหนดการใช้งาน