
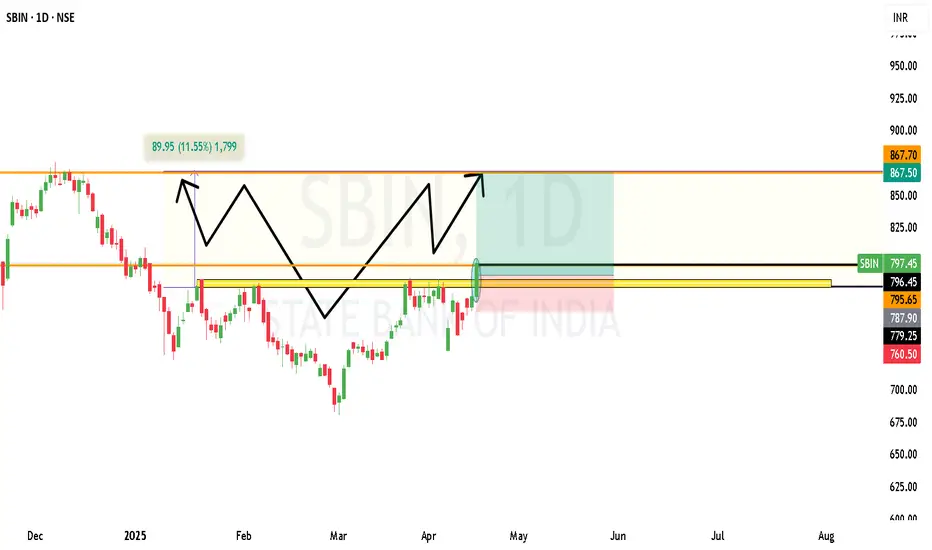
Exciting pattern on SBIN(State Bank Of India) chart!
Validation of my target:
1. Inverted Head & Shoulder pattern confirmed on daily chart.
2. Neckline breakout already happened @ 822
3. Target Calculation: Neckline + (Neckline - head low)
Approx. 874,
4. Technical Indicator also supportive
*RSI trending up from oversold zone
* MACD crossover happened recently.
Target will range between 10 points 864 to 874.
Risk to reward is 1:3
Stop Loss previous low 760
For Educational purpose only

คำจำกัดสิทธิ์ความรับผิดชอบ
ข้อมูลและบทความไม่ได้มีวัตถุประสงค์เพื่อก่อให้เกิดกิจกรรมทางการเงิน, การลงทุน, การซื้อขาย, ข้อเสนอแนะ หรือคำแนะนำประเภทอื่น ๆ ที่ให้หรือรับรองโดย TradingView อ่านเพิ่มเติมใน ข้อกำหนดการใช้งาน
คำจำกัดสิทธิ์ความรับผิดชอบ
ข้อมูลและบทความไม่ได้มีวัตถุประสงค์เพื่อก่อให้เกิดกิจกรรมทางการเงิน, การลงทุน, การซื้อขาย, ข้อเสนอแนะ หรือคำแนะนำประเภทอื่น ๆ ที่ให้หรือรับรองโดย TradingView อ่านเพิ่มเติมใน ข้อกำหนดการใช้งาน