
This project has a different pattern to many others and it looks very promising. It is the best ever because it ended up diving pretty deep.
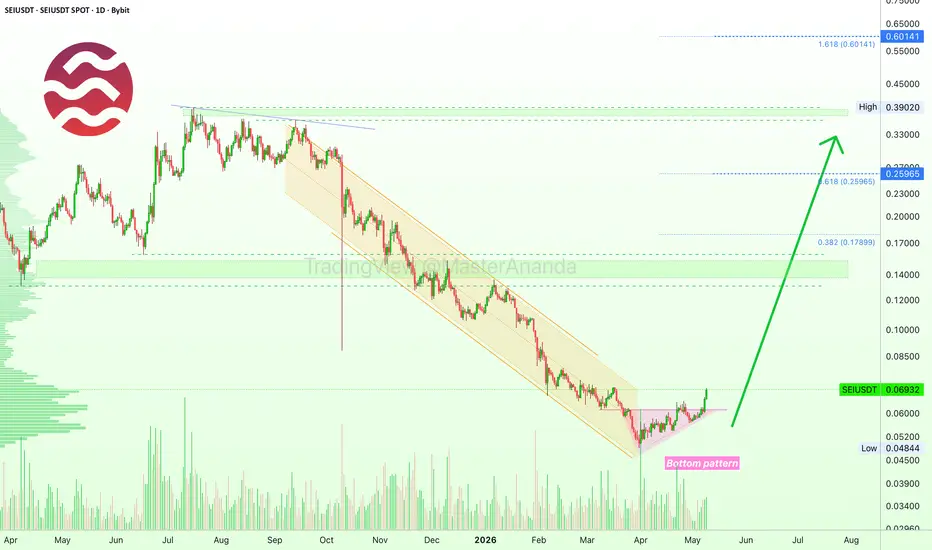
SEIUSDT went much lower 6-February compared to October 2025 and this isn't all. The all-time low happened 31-March rather than February, a little over a month ago.
Right after the bottom a really big volume bar appeared and SEI has been recovering since. While there is some bullish action now, two green candles with today being full green, we are still looking at the bottom zone.
This bottom zone tells us that there is plenty of room still available for maximum growth.
I highlighted two spaces on the chart that can work as resistance based on the recovery phase. The lows from April and June 2025 as well as the peaks from July and September.
This is a friendly reminder. Bullish momentum is about to intensify wild on this project and trading pair. Sometimes it can change though and take a while, but an uptrend now is unavoidable, already in progress.
Expect higher prices short- to mid-term.
Namaste.
SEIUSDT went much lower 6-February compared to October 2025 and this isn't all. The all-time low happened 31-March rather than February, a little over a month ago.
Right after the bottom a really big volume bar appeared and SEI has been recovering since. While there is some bullish action now, two green candles with today being full green, we are still looking at the bottom zone.
This bottom zone tells us that there is plenty of room still available for maximum growth.
I highlighted two spaces on the chart that can work as resistance based on the recovery phase. The lows from April and June 2025 as well as the peaks from July and September.
This is a friendly reminder. Bullish momentum is about to intensify wild on this project and trading pair. Sometimes it can change though and take a while, but an uptrend now is unavoidable, already in progress.
Expect higher prices short- to mid-term.
Namaste.

Trading Cryptocurrencies can be the hardest undertaking ever without the right trade-numbers, without accurate private-access information. Free is free, but the best always requires sweat, an investment. Since 2017 👇
t.me/masteranandatrades/8778
t.me/masteranandatrades/8778
การนำเสนอที่เกี่ยวข้อง
คำจำกัดสิทธิ์ความรับผิดชอบ
ข้อมูลและบทความไม่ได้มีวัตถุประสงค์เพื่อก่อให้เกิดกิจกรรมทางการเงิน, การลงทุน, การซื้อขาย, ข้อเสนอแนะ หรือคำแนะนำประเภทอื่น ๆ ที่ให้หรือรับรองโดย TradingView อ่านเพิ่มเติมใน ข้อกำหนดการใช้งาน
Trading Cryptocurrencies can be the hardest undertaking ever without the right trade-numbers, without accurate private-access information. Free is free, but the best always requires sweat, an investment. Since 2017 👇
t.me/masteranandatrades/8778
t.me/masteranandatrades/8778
การนำเสนอที่เกี่ยวข้อง
คำจำกัดสิทธิ์ความรับผิดชอบ
ข้อมูลและบทความไม่ได้มีวัตถุประสงค์เพื่อก่อให้เกิดกิจกรรมทางการเงิน, การลงทุน, การซื้อขาย, ข้อเสนอแนะ หรือคำแนะนำประเภทอื่น ๆ ที่ให้หรือรับรองโดย TradingView อ่านเพิ่มเติมใน ข้อกำหนดการใช้งาน