
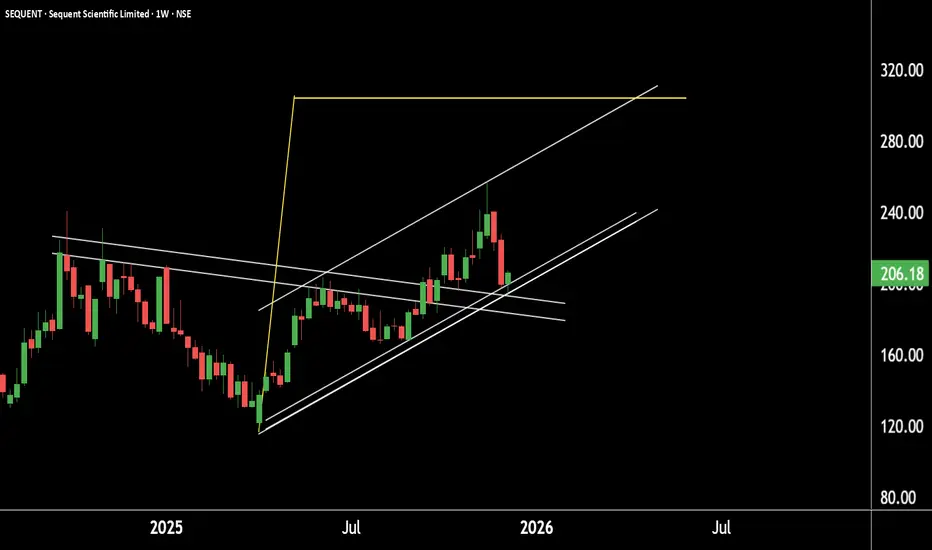
This is the weekly timeframe chart of Sequent Scientific.
The stock is currently trading near the key support zone of 180–190 and is moving within a well-defined structure.
If this support zone holds, we may see a potential upside move towards the 280 and 300 levels.
Thank you.
The stock is currently trading near the key support zone of 180–190 and is moving within a well-defined structure.
If this support zone holds, we may see a potential upside move towards the 280 and 300 levels.
Thank you.

@RahulSarawagi
Connect us at optionlab.co.in/
Connect us at optionlab.co.in/
คำจำกัดสิทธิ์ความรับผิดชอบ
ข้อมูลและบทความไม่ได้มีวัตถุประสงค์เพื่อก่อให้เกิดกิจกรรมทางการเงิน, การลงทุน, การซื้อขาย, ข้อเสนอแนะ หรือคำแนะนำประเภทอื่น ๆ ที่ให้หรือรับรองโดย TradingView อ่านเพิ่มเติมใน ข้อกำหนดการใช้งาน
@RahulSarawagi
Connect us at optionlab.co.in/
Connect us at optionlab.co.in/
คำจำกัดสิทธิ์ความรับผิดชอบ
ข้อมูลและบทความไม่ได้มีวัตถุประสงค์เพื่อก่อให้เกิดกิจกรรมทางการเงิน, การลงทุน, การซื้อขาย, ข้อเสนอแนะ หรือคำแนะนำประเภทอื่น ๆ ที่ให้หรือรับรองโดย TradingView อ่านเพิ่มเติมใน ข้อกำหนดการใช้งาน